


- Accueil
- Volume 28 (2024)
- Numéro 1
- In vitro anaerobic incubation: a reliable method to predict the potential of nitrogen mineralization after grassland ploughing


Visualisation(s): 381 (12 ULiège)
Téléchargement(s): 0 (0 ULiège)

In vitro anaerobic incubation: a reliable method to predict the potential of nitrogen mineralization after grassland ploughing

Document(s) associé(s)
Version PDF originaleRésumé
L'incubation anaérobie : une méthode fiable pour prédire le potentiel de minéralisation de l'azote après le retournement de prairies
Description du sujet. De grandes quantités d'azote peuvent être libérées après le labour des prairies et aucune méthode fiable n'est disponible pour les laboratoires de routine afin d'aider les agriculteurs à gérer ces pratiques culturales.
Objectifs. L'objectif de cette étude était d'évaluer si l'azote potentiellement minéralisable (PMN) est un estimateur fiable de la quantité d'azote réellement minéralisée sur le terrain pendant la saison de croissance suite à un retournement de prairie.
Méthode. L'azote potentiellement minéralisable de trois prairies labourées a été déterminé par incubation anaérobie de sept jours. Les quantités d'azote minéralisé (NO3- -N et NH4+-N) ont été mesurées régulièrement sur les trois parcelles pendant deux ans pour estimer la minéralisation réelle in situ (ISM) à l’aide du modèle de calcul LIXIM.
Résultats. Nos résultats ont indiqué que l'incubation anaérobie d'échantillons de sol de prairie fournit des estimations très proches de la minéralisation in situ calculée par LIXIM (moins de 10 % de différence relative). Une relation étroite (p = 0,0029) a été trouvée entre le potentiel de minéralisation (PMN) et la minéralisation in situ (ISM), avec une forte corrélation (R2 = 0,91). Enfin, cette étude a mis en évidence un niveau très élevé d'azote minéralisé au cours des deux années suivant le labour des prairies, même après une prairie temporaire de courte durée (3 ans).
Conclusions. Le potentiel de minéralisation estimé par incubation anaérobie de courte durée est adapté pour une application aux retournements de prairies indépendamment de l’âge de ces dernières. Cette méthode ne doit être utilisée que si la teneur en N minéral du sol n'est pas trop élevée (< 100 kg N·ha-1 dans notre expérimentation) et la profondeur de minéralisation prise en compte dans le calcul doit être définie rigoureusement pour chaque situation.
Abstract
Description of the subject. Large amounts of nitrogen may be released after grassland ploughing, and no reliable method is available for routine laboratories to help farmers managing these cultural practices.
Objectives. The objective of this study was to assess whether short-term anaerobic potentially mineralizable nitrogen (PMN) is a reliable estimator of the N amount actually mineralized in the field during the growing season after grassland ploughing.
Method. PMN was determined in vitro using a 7-day anaerobic incubation on three plots of grassland that were tilled and monitored for two years. The mineral nitrogen (NO3- -N and NH4+-N) amounts were measured at different times in the three plots and used to estimate the actual in situ mineralization with the LIXIM calculation model (ISM).
Results. Our results indicated that in vitro anaerobic incubation of grassland soil samples provided estimations very close to the actual data of ISM observed during the monitoring (less than 10% of relative difference). A close relationship (p = 0.0029) was found between PMN and ISM with a high correlation (R2 = 0.91). Additionally, our study revealed very high levels of nitrogen mineralization during the first and second year after grassland ploughing, even after temporary grassland of short duration (3 years).
Conclusions. PMN estimated by short-term anaerobic incubation is suitable for a reliable application in grasslands of all ages. This method should be used only if the mineral N content of the soil is not too high (< 100 kg N·ha-1 in our experiment) and the mineralization depth taken in account in the calculation should be defined rigorously in each situation.
Table des matières
Received 4 May 2023, accepted 29 January 2024, available online 21 February 2024.
This article is distributed under the terms and conditions of the CC-BY License (http://creativecommons.org/licenses/by/4.0)
1. Introduction
1There is currently no reliable method to accurately estimate the amount of potentially mineralizable nitrogen (N) after grassland ploughing. This analytical parameter is however important with the increasing number of tilled grasslands in Wallonia (Belgium), which correlates with the reduction of agricultural grassland surface (SPW Environnement, 2023). Grassland can be classified as permanent or temporary. In the EU regulations, permanent grassland is defined as land used to grow grasses or other herbaceous forage naturally (self-seeded) or through cultivation (sown) and that is not included in the farm’s crop rotation for five years or longer (Commission Regulation EU No 796/2004). In contrast, a temporary grassland is a grassland less than five years of age, included in a crop rotation (Carlier & De Vliegher, 2007). Between 1980 and 2015, the area under permanent grassland (43% of the total utilized agricultural area in 2015) declined by 2,576 ha·year-1 on average, a total decrease of 23% mainly due to land take and reduction of soil-based herbivores breeding. Between 2001-2015, a loss of 24% of the total number of cattle in Wallonia was observed, as a consequence of the introduction of milk quotas and of the drop in bovine meat demand (22% reduction between 2005 and 2014) (SPW, 2017). Permanent grasslands are also sometimes ploughed for renewal after degradation of vegetation due to adverse climatic conditions, pests, weeds, overgrazing or boar damages. Additionally, 5% of the agricultural area in Wallonia (7% for Belgium) are under temporary grassland as part of crop rotation. These temporary grasslands are removed after one to five years and followed by arable crops (Reheul et al., 2007). The organic farming development leads to a decrease in permanent grassland areas, replaced by temporary grasslands rich in legumes to increase soil fertility and to lengthen crop rotation (Lambert et al., 2020). For environmental reasons, in Wallonia, destruction of permanent grasslands is banned from 1st June until 31 January. Mineral nitrogen fertilization is forbidden the year after destruction and organic fertilization, vegetable and legumes crops are forbidden during two years after destruction. For temporary grasslands, there are no restrictions (Moniteur belge, 2023).
2There are commonly three methods for grass destruction: mechanical destruction, such as ploughing or other types of tillage; chemical killing with total herbicides and surface covering. The latter is rarely used due to its difficulty to apply on large areas. Chemical destruction, mainly with glyphosate, is often used prior to mechanical destruction to prevent weed regrowth. However, the reduction of chemical herbicides, associated with the development of organic farming, has encouraged tillage as the easiest and most effective way to convert grassland into crop in the absence of herbicides (Deleau et al., 2022).
3Several studies indicate that the amount of mineralized nitrogen could be very high after grassland destruction and might lead to massive nitrogen losses towards the environment (Laurent et al., 2003; Velthof et al., 2010; De Toffoli et al., 2013). This important issue, however, is not fully understood and is far from being controlled. Since the reduction of soil-based herds is likely to continue, permanent grassland areas will probably keep on declining, emphasizing the effects of nitrogen losses due to post-tillage mineralization.
4Global warming also affects grassland management: climate change is predicted to lead to higher temperatures, increased summer droughts, and more frequent heat waves and floods. As a result, phenology would be advanced in many plant species, and changes in species composition are expected (Gibson & Newman, 2019). This phenomenon would lead to the sowing of more adapted and less sensitive species (e.g. alfalfa, mixed alfalfa/grass, etc.), and turning permanent grasslands into temporary ones.
5For all these reasons, there is a need to decrease the environmental impact (massive nitrogen leaching) of the necessary grassland tillage. A better knowledge of the mineralization potential of grasslands before their tillage could allow a better management to minimize nitrogen loss to the environment. Several methods of N mineralization assessment have already been described, from the simple chemical characterizations (total N, organic N, total carbon, dissolved organic carbon, dissolved organic N, pH) to the use of complex predictive models, including field or in vitro methods (Keeney & Bremner, 1966; Keeney, 1982; Boghal et al., 2001; Smit & Velthof, 2010; Clivot et al., 2017). In vitro anaerobic incubation appeared to be a promising method, as it gives reliable results and is quite fast and easy to carry out in routine laboratories. It consists in the incubation of a fraction of fresh sieved soil under waterlog conditions and the measurement of the net amount of NH4+-N produced (Keeney, 1982; Kresovic et al., 2005; Mariano et al., 2013; Clark et al., 2019).
6In the original method (Keeney & Bremner, 1966), the pre-existing NH4+-N in the fresh sample should first be determined and then subtracted from the total amount of mineralized NH4+-N in the sample after anaerobic incubation. According to Keeney (1982) and Mariano et al. (2013), it is possible to disregard this subtraction, avoiding the quantification of pre-existing NH4+-N in the sample. They reported that including the pre-existing NH4+-N in the amounts of mineralized N during incubation, increased the representation of the in situ mineralization process. Nevertheless, these studies were performed on cropland containing low amounts of NH4+-N. In grassland soil, the concentration of NH4+-N could be quite significant in early spring. In some Belgian Ardennes soil, for example, about 30% of the total mineral nitrogen present during early spring is under NH4+-N form (internal unpublished data). This makes the method calculating the net production of NH4+-N (total amount at the end of incubation minus pre-existing NH4+-N in the sample) more suitable, at least for grassland soils in Wallonia, as the final amount of mineralized N could otherwise be overestimated due to the pre-existing NH4+-N.
7The main objective of this study was to assess whether the predicted mineralization potential determined by in vitro anaerobic incubations (predicted mineralized nitrogen or PMN) truly matched the nitrogen amount actually mineralized during the growing season (in situ mineralization or ISM) after grassland ploughing.
2. Materials and methods
2.1. Study site and experimental design
8The study took place on the experimental farm of Michamps, Wallonia, Southern Belgium, in the Ardenne ecoregion at an altitude of 498 m. Three grassland plots of about 0.03 ha each were selected: a permanent grassland (established for more than 30 years ago) on a loamy soil with few stones, an intermediate temporary grassland (8 years) and a young temporary grassland (3 years) both on a loamy-stony soil. The plots were ploughed after glyphosate spraying and milled at the end of March 2015. They were kept clear of vegetation during two growing seasons by harrowing (year 1) and glyphosate spraying (year 2).
2.2. Soil analyses
9The three plots were characterized before tillage: we measured the water content determined gravimetrically according to ISO 11463, the mineral N content (NO3--N and NH4+-N) in three different layers (0-30 cm, 30-60 cm and 60-90 cm) based on the ISO 14256-2 method; the total organic carbon (TOC) using the Walkley-Black method; total N using Kjeldahl method (ISO 11261); pH KCl 1N following ISO 10390 and the cation exchange capacity (CEC) following ISO 23470. We then predicted the soil mineralization potentials using anaerobic incubations based on the Keeney and Bremner method (1966). This method involves the incubation of 5 g of soil samples under waterlogged conditions (addition of 12.5 ml of distilled water) in a closed test tube. The sample is incubated during 7 days at 40 °C and the amount of NH4+-N is determined before and after incubation, by Kjeldahl distillation with 2 mol·l-1 KCl, followed by a titration using 0.01 N HCl. The net production of NH4+-N is assimilated to the mineralization potential (PMN) of the test sample. Results are expressed in kg N·ha-1 based on a soil mass of 3,375 t·ha-1. These incubations are performed in duplicate to ensure analytical repeatability.
10After tillage, anaerobic incubations as well as NO3--N and NH4+-N quantifications were carried out 12 times over the year 2015 (1/04; 16/04; 29/04, 15/05; 04/06; 02/07; 22/07; 01/09; 22/09; 27/10; 24/11 and 09/12). During the second year after tillage, water content, NO3--N and NH4+-N quantifications were carried out about once a month (02/02; 10/03; 29/03; 10/05; 06/06; 30/06; 04/08; 31/08; 11/10) and the anaerobic incubations were carried out in March 2016.
2.3. Soil net N mineralization
11The in situ nitrogen mineralization (ISM) of the tilled grasslands was estimated using the LIXIM calculation model designed by INRA (National Agronomical Research Institute) in France. The robustness of LIXIM was validated by Valé (2006) and Clivot et al. (2017). LIXIM is a layered functional model, with a 1-day time step requiring frequent measurements of water and mineral N content in soil cores, standard meteorological data and soil characteristics (Mary et al., 1999). In this model, the nitrate transport is simulated using the mixing-cells approach. The variation in N mineralization with temperature and moisture are accounted for providing calculation of ‘normalized time’. In this approach, a normalized day corresponds to a calendar day under standard soil temperature in the mineralizing layer and moisture content. Input data in the LIXIM model are:
12– soil water and mineral N contents measured in the laboratory;
13– daily air/soil temperature, rainfall and potential evapotranspiration provided by the PAMESEB agro-meteorological station located near the study sites;
14– bulk density, water contents at permanent wilting point and field capacity of each soil layer and mineralization depth estimated from the Digital Soil Map of Wallonia.
15The mineralization depth was set at 25 cm, which corresponds to the ploughing depth in Ardennes soil; the soil temperature in the mineralizing layer was set equal to 15 °C and the moisture content was set to the field capacity.
16The standard deviation of the LIXIM results is difficult to estimate because of imperfections in the adjustment of the water and nitrogen profiles, combined with the measurement error of the input data (mainly the spatial variability of the water and nitrogen profiles). Valé (2006) pointed that an error of 6% to 12.5% seems acceptable. As the uncertainty of the laboratory nitrate analysis method in our lab is 12% (with an enlargement factor k = 2), we could estimate that a 6% standard deviation of the final ISM is suitable.
3. Results
3.1. Experimental plots characterization
17The physicochemical characteristics of the three plots appeared to be fairly similar, as shown in table 1.
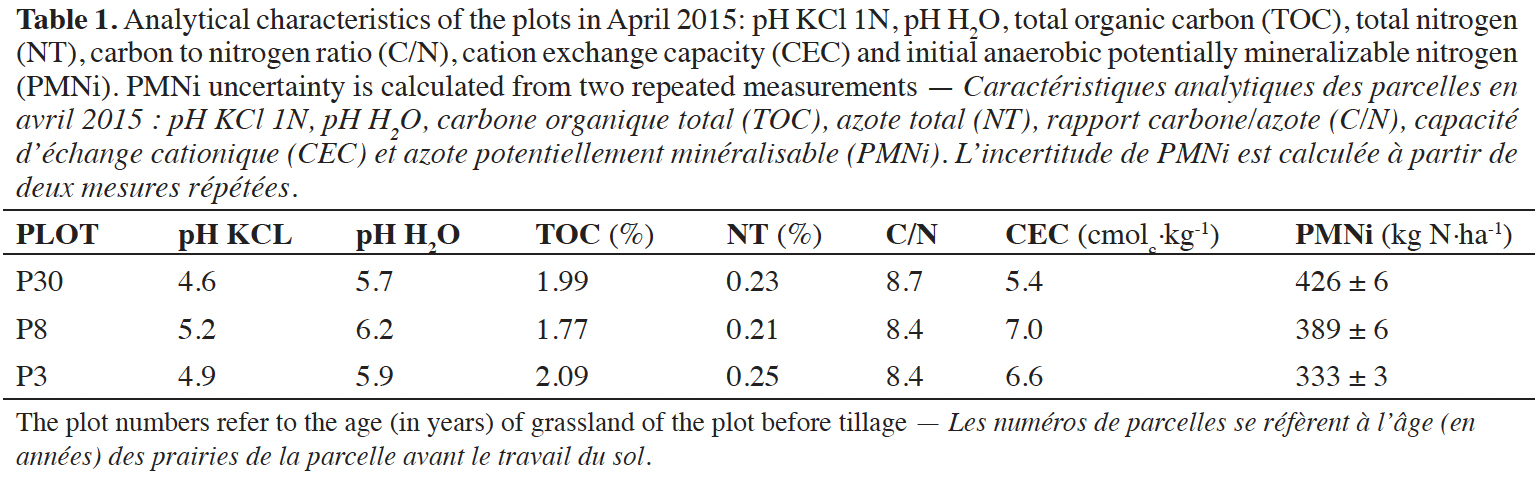
18The organic matter content was quite low for the Ardennes agricultural region, as the mean value of grassland TOC in this region is 3.1% (Genot et al., 2012). The C/N ratio observed in our study reflects a little excess of N and a non-optimal mineralization rate, as this ratio is approximately of 8.5. The cation exchange capacity (CEC) is also very low, but despite this CEC and the C/N ratio, the N mineralization potentials measured before ploughing in the three plots were quite high. For the 30 years old (P30), 8 years old (P8) and 3 years old (P3) grassland plots, we measured mean N mineralization potentials of respectively 426, 389 and 333 kg N·ha-1.
3.2. In situ net N mineralization
19The in vitro incubations predictions (PMN) of the total nitrogen released during the first year were quite similar to the in situ mineralization calculations (ISM), except on the 3-years plot (Figure 1). Results, of respectively 426 and 442 kg N-NO3·ha-1 on P30 (-3.8%), 389 and 366 kg N-NO3·ha-1 on P8 (+5.8%) were not significantly different. In contrast, results on P3 were significantly different with 333 kg N-NO3·ha-1 predicted with PMN and only 219 kg N-NO3·ha-1 of ISM calculated by LIXIM (-34.2%). The PMN and ISM estimations were quite similar in 2016 on the three plots. Results, of respectively 130 and 117 kg N-NO3·ha-1 on P30, 100 and 90 kg N-NO3·ha-1 on P8 and 100 and 91 kg N-NO3·ha-1 on P3, were not significantly different for each of the plots (Figure 1). The PMN predicted by incubation for the 2nd year are very similar (respectively higher by 1.0%, 4.0% and 6.2%), to the in situ mineralization calculated by LIXIM on the three plots P3, P8 and P30.
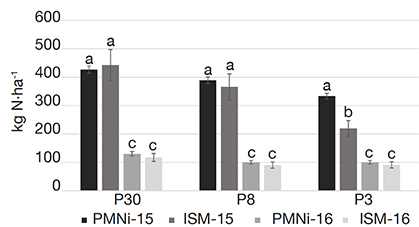
Figure 1. Comparison of initial anaerobic potentially mineralizable nitrogen calculated in April 2015 (PMNi-15) and March 2016 (PMNi-16) to LIXIM’s modelling result of net in situ N mineralization from April to December 2015 (ISM-15) and from March to October 2016 (ISM-16) on the three plots of the experiment. Results are expressed in kg N.ha-1 — Comparaison de l’azote potentiellement minéralisable calculé en avril 2015 (PMNi-15) et en mars 2016 (PMNi-16) avec le résultat de la modélisation de LIXIM de la minéralisation nette d’azote in situ au cours de la première année d’avril à décembre 2015 (ISM-15) et de la seconde année de mars à octobre 2016 (ISM-16) sur les trois parcelles. Les résultats sont exprimés en kg N.ha-1.
Values (± SD) with the same letter do not differ significantly at 5% probability — Les valeurs (± ET) avec la même lettre ne diffèrent pas significativement avec une probabilité de 5 %.
20The results of LIXIM estimations of the total nitrogen released may have been influenced by the estimated soil properties (e.g. bulk density or water contents at permanent wilting point and field capacity), which are essential for the in situ modelling by LIXIM (Valé, 2006). However, the fact that LIXIM’s modelling on the 3-years plot (Figure 1) is significantly lower than the potential mineralization assessed by incubation, could be partly explained by the fact that P3 could not be kept totally clear of vegetation during early summer 2015. Indeed, in June, the 3-years plot was quickly fully covered by wild carrots (Daucus carota L.). The wild carrots were partly manually extracted from the soil early July and the other pat was mowed. This induced two biases in our measurements. First, these plants consumed nitrates from the soil, estimated between 30 to 50 kg N·ha-1 as the amount of plants removed was quite huge. This could be confirmed taking into account the evolution of the N content in the soil: the N amount measured early July was lower than the N amount measured early June (Figure 2).
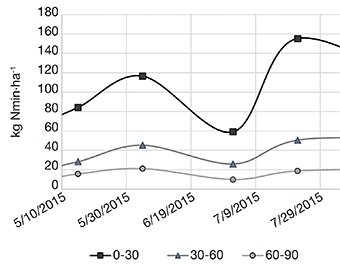
Figure 2. Evolution of the mineral N content (NO3--N and NH4+-N) by horizon depth (: 0-30 cm; : 30-60 cm; : 60-90 cm) of P3 plot from early May to end of July 2015, highlighting the impact of unexpected wild carrots (Daucus carota L.) growth — évolution de la teneur en azote minéral (NO3--N et NH4+-N) par horizon de sol ( : 0-30 cm ; : 30-60 cm; : 60-90 cm) de la parcelle P3 de début mai à fin juillet 2015, mettant en évidence l’impact de la croissance de carottes sauvages (Daucus carota L.).
21The second bias was due to the residual fractions of roots in the ground and to the subsequent slight tillage of the soil. Between June 4 and July 2, two heavy rainfalls were also recorded (20 and 27 mm for 62 mm during the period). The slight tillage and the roots may have induced preferential flow that emphasized the leaching of nitrate during these heavy rains. The tillage and the residues could have then stimulated microbial activity on this plot in July.
22As LIXIM is designed for bare soil and does not take into account such experimental biases, we could assume that the model was not able to interpret correctly the analytical result in July on the 3-years plot. The actual net N mineralization of the P3 was probably higher but it is not possible to determine the accurate value.
3.3. N mineralization dynamics and predictions
23As shown in figure 3, N is continuously mineralized through the cultural year and the final amount of mineralized N was in line with the predictions. Indeed, the total amount of mineralized N (ISM) at the end of the year 2015 reached 410 kg N·ha-1 in the 30-years plot, 377 kg N·ha-1 in the 8-years plot and 348 kg N·ha-1 in the 3-years one.
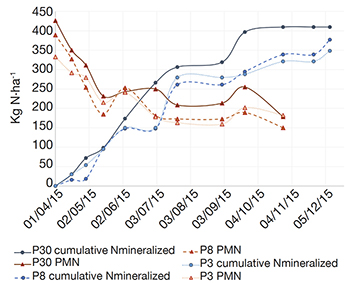
Figure 3. Evolution of the anaerobic potentially mineralizable nitrogen (PMN, ) and the net cumulative amount of N mineralized in situ (ISM, •) on the three plots (P30, P8 and P3) from April to December 2015. P30 is a 30-years old grassland, P8 a 8-years grassland and P3 a 3-years old grassland — Évolution de l’azote potentiellement minéralisable (PMN, ) et de la quantité cumulée nette d’azote minéralisé in situ (ISM, •) sur les trois parcelles (P30, P8 et P3) d’avril à décembre 2015. P30 est une prairie de 30 ans, P8 une prairie de 8 ans et P3 une prairie de 3 ans.
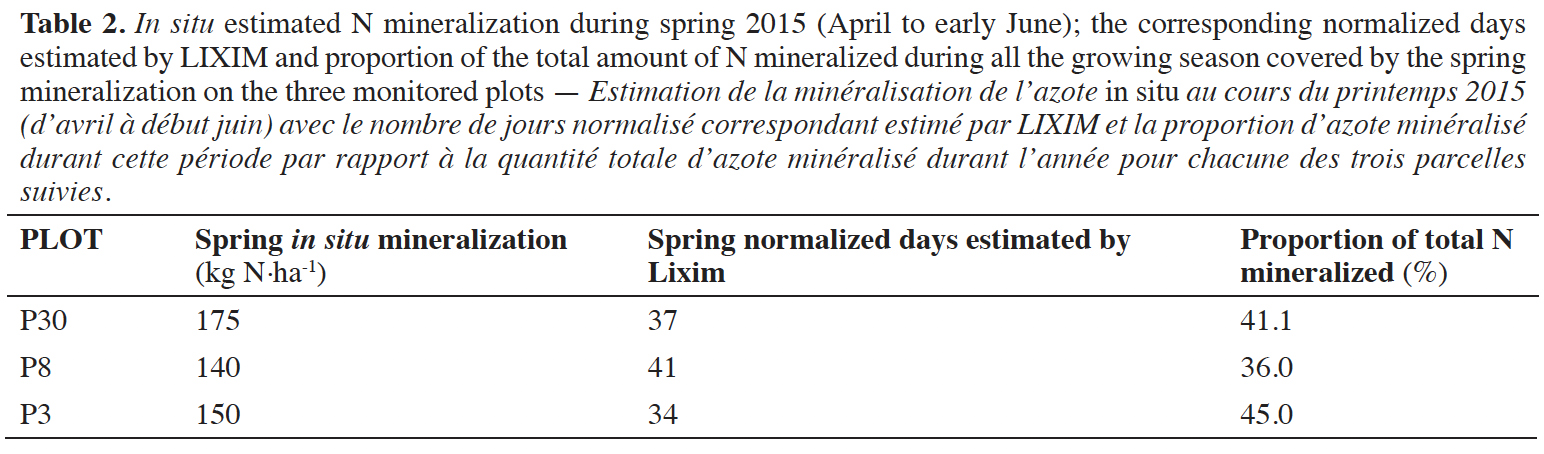
24Looking closer at spring 2015 (from April to early June), as shown in table 2, we observe that 36.0 to 45.0% of the predicted amount of nitrogen is mineralized during spring.
25If we now have a look at the evolution of the mineralization potential predicted throughout the first year (Figure 3), two distinct phases can be observed. The first one corresponds to a continuous and rapid decrease of the potential in the first part of the agricultural season (until mid-May). During this period, N is continuously mineralized and accumulated. The more N is mineralized, the more the potential amounts predicted to be mineralized are decreasing, which makes sense. To assess the relationship between these two phenomena, we tested the correlation between the net amount of N mineralized during each sampling period — from end of March to mid-May — of the two years of monitoring, and the decrease of the mineralization potential during the same period. This way we ensure the independence of the data. We obtained a correlation coefficient (R) of 0.589, which is higher than the critical value of 0.576 (k = 10; α = 0.05) defined by Dagnelie (1970). This proves that the mineralization potential is significantly correlated to the actual amounts of N mineralized during the spring period.
26The second phase (from June to November 2015) shows a slower evolution of the predicted mineralization potential. The predictions remain quite stable, around 200-250 kg N-NO3·ha-1 while, on the other hand, N continues to be mineralized. During this period, N continues first to be accumulated in the 0-30 cm layer, except on P3 as already observed, and then decreases until end of the year, mainly due to reorganization and lixiviation (Figure 4).
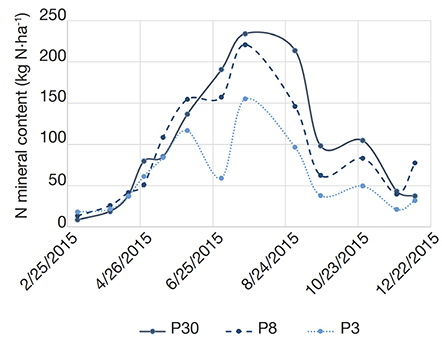
Figure 4. Evolution of the mineral N content (NO3- + NH4+) of the 0-30 cm layer of the three monitored plots P30, P8 and P3, during the first year of monitoring — évolution de la teneur en azote minéral (NO3- + NH4+) de l’horizon 0-30 cm des trois parcelles (P30, P8 et P3) durant la première année de monitoring.
27Results expressed in normalized days (Figure 5) shows that the simulated normalized time by LIXIM is not the same on the three monitored plots (ranged from 137 normalized days on P3 to 182 on P30). Indeed, the soil moisture content may differ on the three plots, due to possible differences in the soil structure. This allows us to compare the potential net N mineralization rates (Vp) calculated by LIXIM. Vp is 2.30 kg·ha-1·day-1 on the 30-years plot (R² = 0.97), 2.06 kg·ha-1·day-1 on the 8-years plot (R² = 0.91) and only 1.61 kg·ha-1·day-1 on the 3-years plot (R² = 0.75).
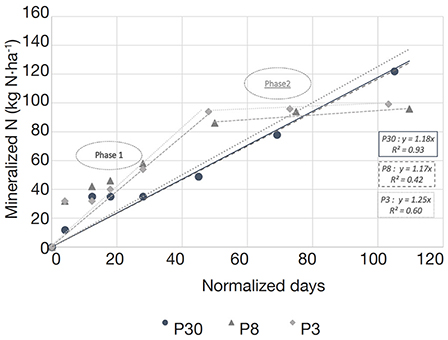
Figure 5. Calculated cumulative amounts of net N mineralized against normalized time obtained with LIXIM in each of the three plots (P30, P8 and P3) of field experiment in 2015. Linear regression and coefficient of determination (R²) are indicated for each plot — Quantités nettes d’azote minéralisé par rapport au temps normalisé, déterminés par LIXIM, pour chacune des trois parcelles (P30, P8 et P3) suivies en 2015. La régression linéaire et le coefficient de détermination (R²) sont indiqués pour chaque parcelle.
28As illustrated in figure 6, the potential net N mineralization rates (Vp) calculated by LIXIM on the 2016 data are 1.18 kg·ha-1·day-1 on the 30-years plot (R² = 0.93), 1.17 kg·ha-1·day-1 on the 8-years plot (R² = 0.42) and 1.25 kg·ha-1·day-1 on the 3-years plot (R² = 0.60). Although significant, the correlations on P8 and P3 are weak and can be explained by looking at the graph. Indeed, two phases can be distinguished for nitrogen accumulation on these two plots. Phase 1 corresponds to the phase of rapid mineralization rate of P3 and P8 during the first 50 normalized days, while phase 2 is the 2nd phase where the mineralization rate drops drastically due to the depletion of rapidly mineralizable nitrogen resources of P3 and P8 plots. During phase 1 Vp are respectively 2.03 kg·ha-1·day-1 (R² = 0.86) on P3 and 1.95 kg·ha-1·day-1 (R² = 0.72) on P8 whereas during phase 2 they drastically fall down to respectively 0.09 kg·ha-1·day-1 (R² = 0.99) and 0.16 kg·ha-1·day-1 (R² = 0.83).
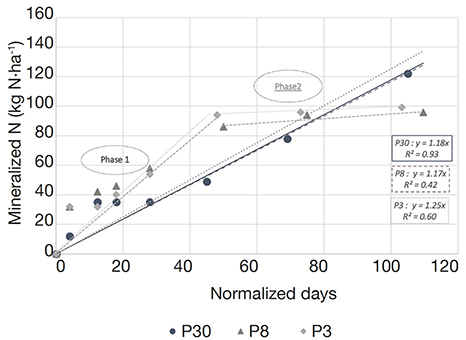
Figure 6. Calculated cumulative amounts of net N mineralized against normalized time obtained with LIXIM in each of the three plots (P30, P8 and P3) of field experiment in 2016. Linear regression and coefficient of determination (R²) are indicated for each plot. Phase 1 corresponds to the phase of rapid mineralization rate of P3 and P8 during the first 50 normalized days, while phase 2 is the 2nd phase where the mineralization rate drops drastically due to the depletion of rapidly mineralizable nitrogen resources of P3 and P8 plots — Quantités nettes d’azote minéralisé par rapport au temps normalisé, déterminées par LIXIM, pour chacune des trois parcelles (P30, P8 et P3) suivies en 2016. La régression linéaire et le coefficient de détermination (R²) sont indiqué pour chaque parcelle. La phase 1 correspond à la phase rapide de minéralisation de P3 et P8 pendant les 50 premiers jours normalisés, tandis que la phase 2 est la phase où la vitesse de minéralisation chute drastiquement en raison de l’épuisement des ressources en azote rapidement minéralisable des parcelles P3 et P8.
29Finally, we tested the relationship between initial anaerobic potentially mineralizable nitrogen (PMNi) and in situ estimation (ISM) on the three plots over the two years of monitoring (Figure 7). We can observe a highly significant correlation between PMNi and ISM (R2 = 0.914; R = 0.956; p-level = 0.0029).
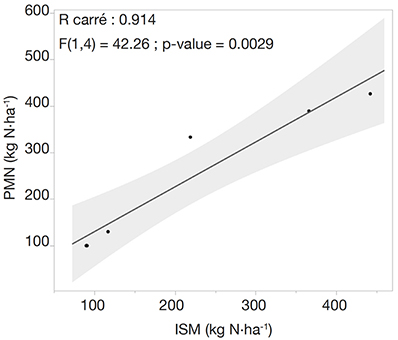
Figure 7. Correlation between LIXIM modelling of in situ mineralization (ISM) and the initial anaerobic potentially mineralizable nitrogen (PMNi) on the three plots of the experiment during the two years of monitoring (n = 6). Shaded areas represent the confidence interval of linear regressions — Corrélation entre la modélisation LIXIM de la minéralisation in situ (ISM) et l’azote potentiellement minéralisable (PMNi) sur les trois parcelles de l’expérience pendant les deux années de suivi (n = 6). Les zones ombrées représentent l’intervalle de confiance des régressions linéaires.
4. Discussion
4.1. ISM determination and use of normalized time
30Our study was conducted in the framework of grassland. For this system, the actual Vp rates calculated by LIXIM, varying between 1.17 and 2.30 kg N·ha-1·day-1, are comparable to those estimated from in situ core methods in grasslands: 0.20 to 2.30 kg N·ha-1·day-1 as compiled in Jarvis et al. (1996) and 0.50 to 1.50 kg N·ha-1·day-1 measured by Hatch et al. (2000).
31The use of a standardized time makes sense in order to make comparisons of soils from different origins and over different years. However, this standardized time notion is difficult to predict at the beginning of the season as it is highly influenced by climatic conditions, themselves not accurately predictable. Our results lead to question the extrapolation of normalized time to the field and their possible use for fertilization advice. The 2016 monitoring, from March to October, allows the calculation of a normalized time of 103 to 110 normalized days (ND) depending on the plots. In 2015, the follow-up from March to December calculates a normalized time of 137 to 182 ND. If we consider the same period in 2015 as in 2016 (March to October), the ND calculation on the three plots are 117, 146 and 163 ND. This represents a difference of 14 to 50 ND between 2015 and 2016 for the same period on the same plots. This difference is difficult to predict and compromises the use of ND in the fertilization advice. Normalized time is also used to make comparisons with soil incubations, as it can correlate with aerobic incubations at moderate temperature with controlled humidity close to field capacity. However, in the context of anaerobic incubations as used in this study, it is difficult to establish a correlation with normalized time. Indeed, incubation at 40 °C induces a massive inactivation of part of the microbiome, releasing organic nitrogen that will rapidly be available for mineralization. Moreover, under waterlogged conditions, there is a proteolysis of the organic nitrogen contained in the proteins of the organic matter, partly under the effect of the free cytoplasmic enzyme released following the cell lysis of the microbiome, which finally leads to the release of ammonium. The conditions of anaerobic incubation being very different from those encountered in the field, it is difficult to “time normalize” this process.
4.2. Reliability of anaerobic incubations
32Our 2-years monitoring of tilled grassland confirmed the suitability of anaerobic incubations to predict N mineralization, as the predictions (PMN) are quite close to the actual estimated in situ net mineralization (ISM) for both years of monitoring on the three plots.
33The relative stability of the PMN prediction observed during the summer of the 1st year on plots could be explained by a possible limitation of the incubation method (which is based on the production of NH4+ by bacteria, under anaerobic conditions). Indeed, large amounts of N-NO3- (over 100 kg·ha-1 in the 0-30 cm layer of the three plots in our observation during summer of the 1st year as shown on figure 4) could affect the activity of bacteria in anaerobia. Another nitrate-reduction process could hinder the denitrification pathway: the dissimilatory nitrate reduction to ammonium (DNRA) pathway (Figure 8).
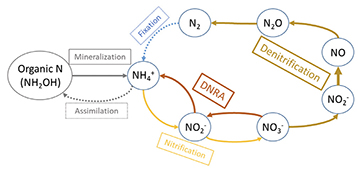
Figure 8. Partial nitrogen cycle in soils: main pathways with an emphasis on nitrification, denitrification and DNRA. Under oxic conditions, ammonium is reduced into nitrite and nitrate via nitrification, and under anoxic conditions, consumption of nitrate and nitrite can lead to either N2 production (N loss) via denitrification or NH4+ (N retention) via DNRA (Dissimilatory Nitrate Reduction into Ammonium). Fixation of N2 and assimilation of NH4+ ( ) are existing but not dominant pathways — Cycle partiel de l’azote dans les sols : les principales voies métaboliques, avec l’accent mis sur la nitrification, la dénitrification et la DNRA. Dans des conditions oxydantes, l’ammonium est converti en nitrite et nitrate par nitrification et dans des conditions anoxiques, la consommation de nitrate et nitrite peut conduire soit à la production de N2 (perte d’azote) par dénitrification, soit à la production de NH4+ (rétention d’azote) par DNRA (Réduction du Nitrate en Ammonium). La fixation de N2 et l’assimilation de NH4+ ( ) sont des voies existantes mais non dominantes.
34During denitrification, nitrate is reduced to nitrogen gas, whereas in DNRA, ammonium is the end product. Ammonium is also the final product of our incubations, which is measured to predict mineralization. The ammonium produced by DNRA can thus interfere with our predictions, especially when the rate of DNRA is high. Numerous studies are currently carried out to elucidate the role of the DNRA pathway in the soil nitrogen cycle and the factors controlling its occurrence (Rutting et al., 2011; Giles et al., 2012; Thamdrup, 2012; Yoon et al., 2014; Smith et al., 2015; Li et al., 2020; Pandey et al., 2020). The main factors influencing DNRA activity seem to be the redox potential, C/N ratio, quality of C, NO2/NO3 ratio, generation time of bacteria and S2- and Fe2+ concentrations (Pandey et al., 2020). Although no consensus is emerging on how all these factors induce or inhibit the DNRA pathway, most authors agree that DNRA predominates to denitrification when the C/N ratio is high (> 4.5), which is the case of all our soils during incubations. Furthermore, Yoon et al. (2014), using culture experiments with Shewanella loihica strain PV-4, a bacterium possessing both the denitrification and DNRA pathways and reported to grow over a temperature range of 0 °C to 42 °C, highlighted that incubation above pH 7.0 and increasing temperatures, tested up to 37 °C, promoted ammonium formation. Therefore, we must assume that the DNRA could be a significant pathway of nitrate reduction during our incubation at 40 °C and introduced a bias in our observations after July when NO3--N concentration in the top layer soil is over 100 kg·ha-1. In these conditions, the predicted mineralization potential may be overestimated. To avoid this bias, PMN should be used for fertilization advice and estimates in early season, when amount of mineral N in soil is usually low.
4.3. Impact of grassland tillage
35The amount of mineralized nitrogen observed during spring 2015 should be sufficient to feed most of the usual recommended crops after a grassland tillage (as maize, fodder beet, or another grassland) during this period. Indeed, the releases of N-NO3- range between 140 and 175 kg N-NO3-·ha-1, which covers more than the half of the total N needs of these crops. Of course, the ability of plants to uptake this mineralized N will depend on multiple factors not discussed here (e.g.: roots interaction, variety, climatic conditions, etc.). Our results also indicate that a huge amount of N is still mineralized during summer and autumn (up to 64%), which highlights the need to keep the soil covered by crops. In a covered soil, the mineralized nitrogen will continuously be assimilated and reorganized, until the end of the season and during winter, avoiding massive nitrate leaching after grassland tillage. Indeed, from October to mid-December, we observed that 83 kg N·ha-1 and 60 kg N·ha-1 were still mineralized on P8 and P3, respectively. An explanation of these high mineralization rates could be the rather mild autumn 2015: the mean temperature recorded on the plots from October to December 2015 (7.1 °C) was the highest of the 2010-2019 period (5.7 +/- 0.8 °C). As temperature is one of the key factors controlling N processes and specifically mineralization, we can reasonably expect lower amounts of late mineralization during cooler autumns.
36The constant mineralization over the years has some limitations, especially relying on labile N availability (Sano et al., 2006). Observed correlations between the calculated cumulative amounts of net N mineralized against normalized time obtained with LIXIM in each of the three plots (P30, P8 and P3) during the 2nd year of monitoring are lower than those observed during the 1st year. This can be explained looking at figure 6. Indeed, for P3 and P8, we can distinguish two phases of mineralization characterized by different mineralization rates. Vp is quite high during the first 50 normalized days (1.96 kg N·ha-1·day-1 on P8 [R² = 0.96] and 2.03 kg N·ha-1·day-1 on P3 [R² =0.86]) and then decreases strongly. This could indicate a depletion of the rapidly mineralizable fraction of nitrogen in these plots, in opposition to what is observed on P30, the plot with the highest organic matter content, on which Vp is constant until the end of the growing season.
37The 2-years monitoring also confirms that the N amount mineralized subsequently to tillage can be very significant (up to 500 kg N·ha-1), as already highlighted by previous studies (Laurent et al., 2003; De Toffoli et al., 2013). However, we did not expect mineralization to be so significant after short-duration temporary grassland, as in the 3 years old plot where mineralization exceeded 300 kg N·ha-1, which had not been observed before.
4.4. Limitations and impacting factors
38Before concluding, it should be pointed out that a large number of parameters, some of which cannot be measured or estimated, influence the amount of N in soils. One factor that might influence the amount of mineralized N measured in soils was mainly disregarded during this study: it is the loss of nitrous oxide (N2O) and nitric oxide (NO) in the gaseous form, which can be released in large amounts from the soil. This phenomenon is due to nitrification and denitrification after tillage, phenomena increased by several parameters (i.e. soil compaction, N fertilization or after rainfall), as highlighted by several authors (Yamulki & Jarvis, 2002; Pinto et al., 2004; Velthof et al., 2010; Ruan & Robertson, 2013). Rees et al. (2012) refer to an average emission of N2O-N in grasslands of 7 kg·ha-1·yr-1, across their European experimental network. They observed a range of 0-21 kg N2O-N·ha-1·yr-1 among sites and a maximum of 51 kg N2O-N·ha-1·yr-1 on one site with specific treatments (grazing and fertilization). The amount of gaseous N emission is difficult to predict, as it depends on many parameters and conditions. We can however assess that, in our specific experimental conditions, an amount of 5 to 15 kg N2O-N·ha-1·yr-1 could have been lost. Considering these low possible losses due to gaseous nitrous and nitric oxides emissions, the outcome shows highly fitted results provided by anaerobic incubations, which confirms that the anaerobic incubation method enabled a quite reliable estimation of the real nitrogen mineralization potential of the tilled grasslands.
39However, one parameter remains, that has to be considered with caution as it could significantly affect the results of the mineralization potential: the depth of soil considered in the methodology. Indeed, the NH4+-N content resulting from incubation is directly correlated to the amount of soil present on 1 ha, which depends on the quantity of stones in the ground and on the mineralization depth. Taking into account a mineralization depth of 30 cm instead of 25 cm would increase the mineralization potential by 20%, which could significantly impact the fertilization advice. For this reason, the mineralization depth needs to be fixed rigorously according to each plot and cultural practice.
40This incubation methodology turned out to be promising too for the analysis of arable cropping systems, to improve the fertilization advices. It should now be transposed to other types of soils, to assess its robustness in different conditions. Comparisons should also be conducted with other soil types in Wallonia, to assess the actual mineralization depth that should be taken into account in the predictions.
5. Conclusions
41According to our results and under our study conditions, we can confirm that anaerobic incubation represents a sufficiently accurate method to predict the nitrogen mineralization potential of a tilled grassland. To avoid systematic bias, this method should be used with caution if the mineral N content of the incubated soil is already high (higher than 100 kg N·ha-1 in our study). The mineralization depth, considered to estimate the net amount of mineral nitrogen that will be produced by hectare, should be defined rigorously in each situation.
42Our results highlighted that net nitrogen mineralization can be very important (> 300 kg N·ha-1) after the destruction of an only 3 years old temporary grassland, in rotation systems with a lot of temporary grasslands and having a high organic matter content with a low C/N, which was not observed previously.
Acknowledgements
43We would like to thank the Walloon Region for funding this research through the REQUASUD framework agreement.
Bibliographie
Bhogal A. et al., 2001. Evaluation of two N cycle models for the prediction of N mineralization from grassland soils in the UK. Soil Use Manage., 17, 163-172, doi.org/10.1111/j.1475-2743.2001.tb00023.x
Carlier L. & De Vliegher A., 2007. Permanent and temporary grassland: plant, environment and economy. Merelbeke, Belgium: ILVO.
Clark J.D. et al., 2019. United States Midwest soil and weather conditions influence anaerobic potentially mineralizable nitrogen. Soil Sci. Soc. Am. J., 83, 1137-1147, doi.org/10.2136/sssaj2019.02.0047
Clivot H. et al., 2017. Quantifying in situ and modeling net nitrogen mineralization from soil organic matter in arable cropping systems. Soil Biol. Biochem., 111, 44-59, doi.org/10.1016/j.soilbio.2017.03.010
Dagnelie P., 1970. Théories et méthodes statistiques : applications agronomiques (vol. 2). Gembloux, Belgique : Les Presses agronomiques de Gembloux.
Deleau D. et al., 2022. Rénovation des prairies : comment se passer du glyphosate et du labour ? Fourrages, 250, 95-104.
De Toffoli M., Oost J.F. & Lambert R., 2013. Impact de la destruction de prairie sur le reliquat d’azote et la gestion de la fertilisation azotée. Biotechnol. Agron. Soc. Environ., 17(S1), 187-194.
Genot V. et al., 2012. Base de données sols de REQUASUD – 3e synthèse. Gembloux, Belgique : ASBL REQUASUD.
Gibson D. & Newman J., 2019. Grasslands and climate change: an overview. Chapter 1. In: Gibson D. & Newman J., eds. Grasslands and climate change. Cambridge, UK: Cambridge University Press, 1-13, doi.org/10.1017/9781108163941.003
Giles M., Morley N., Baggs E.M. & Daniell T.J., 2012 Soil nitrate reducing processes - drivers, mechanisms for spatial variation, and significance for nitrous oxide production. Front. Microbiol., 3, article 407, doi.org/10.3389/fmicb.2012.00407
Hatch D.J. et al., 2000. Nitrogen mineralization and microbial activity in permanent pastures amended with nitrogen fertilizer or dung. Biol. Fertil. Soils, 30, 288-293, doi.org/10.1007/s003740050005
Jarvis S.C., Stockdale E.A., Shepherd M.A. & Powlson D.S., 1996. Nitrogen mineralization in temperate agricultural soils: processes and measurement. Adv. Agron., 57, 187-235, doi.org/10.1016/S0065-2113(08)60925-6
Keeney D.R., 1982. Nitrogen-availability indices. In: Page A.L., ed. Methods of soil analysis. Part 2: Chemical and microbiological properties. Madison, WI, USA: Soil Science Society of America and American Society of Agronomy, Agronomy Monograph 9, doi.org/10.2134/agronmonogr9.2.2ed.c35
Keeney D.R. & Bremner J.M., 1966. Comparison and evaluation of laboratory methods of obtaining an index of soil nitrogen availability. Agron. J., 58, 498-503, doi.org/10.2134/agronj1966.00021962005800050013x
Kresović M.M., Antić-Mladenović B.S. & Ličina Đ.V., 2005. Aerobic and anaerobic incubation: biological indexes of soil nitrogen availability. Proc. Natl. Sci. Matica Srpska Novi Sad, 109, 45-57, doi.org/10.2298/ZMSPN0519045K
Lambert R. et al., 2020. Production fourragère et sécheresse, quelles solutions en Wallonie ? In : Actes des Journées AFPF, 3-4 November 2020, 55-62
Laurent F. et al., 2003. Effet de la destruction de prairies pâturées sur la minéralisation de l'azote : approche au champ et propositions de quantification. Synthèse de 7 dispositifs expérimentaux. Saint-Hilaire-en-Woëvre, France : ARVALIS, Institut du végétal.
Li X. et al., 2020. Nitrogen reduction processes in paddy soils across climatic gradients: key controlling factors and environmental implications. Geoderma, 368, 114275, doi.org/10.1016/j.geoderma.2020.114275
Mariano E. et al., 2013. Incubation methods for assessing mineralizable nitrogen in soils under sugarcane. Rev. Bras. Ciênc. Solo, 37(2), 450-461, doi.org/10.1590/S0100-06832013000200016
Mary B., Beaudoin N., Justes E. & Machet J., 1999. Calculation of nitrogen mineralization and leaching in fallow soil using a simple dynamic model. Eur. J. Soil Sci., 50, 549-566, doi.org/10.1046/j.1365-2389.1999.00264.x
Moniteur belge, 2023. Arrêté du Gouvernement wallon modifiant la partie règlementaire du Livre II du Code de l'Environnement, contenant le Code de l'eau, en ce qui concerne la gestion durable de l'azote en agriculture. Monit. Belg., 05.04.2023.
Pandey C. et al., 2020. DNRA: A short-circuit in biological N-cycling to conserve nitrogen in terrestrial ecosystems. Sci. Total Environ., 738, 139710, doi.org/10.1016/j.scitotenv.2020.139710
Pinto M. et al., 2004. Increased emissions of nitric oxide and nitrous oxide following tillage of a perennial pasture. Nutr. Cycling Agroecosyst., 70, 13-22, doi.org/10.1023/B:FRES.0000049357.79307.23
Rees R.M. et al., 2012. Nitrous oxide emissions from European agriculture; an analysis of variability and drivers of emissions from field experiments. Biogeosciences, 10, 2671-2682, doi.org/10.5194/bg-10-2671-2013
Reheul D., DeVliegher A., Bommelé L. & Carlier L., 2007. The comparison between temporary and permanent grassland. In: De Vliegher A. & Carlier L., eds. Proceeedings of 14th Symposium, Permanent and Temporary Grassland Plant, Environment and Economy, 3-5 September 2007, European Grassland Federation, Ghent, Belgium. Volume 12, Grassland Science in Europe, 1-13
Ruan L. & Robertson G.P., 2013. Initial nitrous oxide, carbon dioxide, and methane costs of converting conservation reserve program grassland to row crops under no-till vs. conventional tillage. Global Change Biol., 19(8), 2478-2489, doi.org/10.1111/gcb.12216
Rütting T., Boeckx P., Müller C. & Klemedtsson L., 2011. Assessment of the importance of dissimilatory nitrate reduction to ammonium for the terrestrial nitrogen cycle. Biogeosciences, 8, 1779-1791, doi.org/10.5194/bg-8-1779-2011
Sano S., Yanai J. & Takashi K., 2006. Relationships between labile organic matter and nitrogen mineralization in Japanese agricultural soils with reference to land use and soil type. Soil Sci. Plant Nutr., 52, 49-60, doi.org/10.1111/j.1747-0765.2006.00003.x
Smit A. & Velthof G.L., 2010. Comparison of indices for the prediction of nitrogen mineralization after destruction of managed grassland. Plant Soil, 331, 139-150, doi.org/10.1007/s11104-009-0240-6
Smith C.J. et al., 2015. Seasonal variation in denitrification and dissimilatory nitrate reduction to ammonia process rates and corresponding key functional genes along an estuarine nitrate gradient. Front. Microbiol., 6, 542, doi.org/10.3389/fmicb.2015.00542
SPW - DGO3 - DEMNA - DEE, 2017. State of Environment Report - Wallonia 2017 (SOERW 2017). Jambes, Belgium: SPW Éditions, http://etat.environnement.wallonie.be, (2/6/2024).
SPW Environnement - DEMNA – DEE, 2023. The Walloon environment in 10 infographics. SPW Jambes, Belgium: SPW Éditions, http://etat.environnement.wallonie.be, (2/6/2024).
Thamdrup B., 2012. New pathways and processes in the global nitrogen cycle. Annu. Rev. Ecol. Evol. Syst., 43(1), 407-428, doi.org/10.1146/annurev-ecolsys-102710-145048
Valé M., 2006. Quantification et prédiction de la minéralisation nette de l'azote du sol in situ, sous divers pédoclimats et systèmes de culture français. Toulouse, France : Institut National Polytechnique de Toulouse.
Velthof G.L. et al., 2010. Method and timing of grassland renovation affects herbage yield, nitrate leaching, and nitrous oxide emission in intensively managed grasslands. Nutr. Cycl. Agroecosyst., 86, 401-412, doi.org/10.1007/s10705-009-9302-7
Yamulki S. & Jarvis S.C., 2002. Short-term effects of tillage and compaction on nitrous oxide, nitric oxide, nitrogen dioxide, methane and carbon dioxide fluxes from grassland. Biol. Fertil. Soils, 36, 224-231, doi.org/10.1007/s00374-002-0530-0
Yoon S. et al., 2014. Denitrification versus respiratory ammonification: environmental controls of two competing dissimilatory NO3-/NO2- reduction pathways in Shewanella loihica strain PV-4. ISME J., 9(5), 1093-1104, doi.org/10.1038/ismej.2014.201