


- Accueil
- Volume 26 (2022)
- Special issue : 150 years of CRA-W
- Performance of three handheld NIR spectrometers for predicting grass silage quality


Visualisation(s): 848 (41 ULiège)
Téléchargement(s): 16 (0 ULiège)

Performance of three handheld NIR spectrometers for predicting grass silage quality

Document(s) associé(s)
Version PDF originaleRésumé
Performance de trois spectromètres NIR portatifs pour prédire la qualité de l'ensilage d’herbe
Description du sujet. L'alimentation des animaux est la principale charge variable en élevage laitier. Une utilisation plus efficiente des ressources fourragères est un moyen de réduire les couts de production. L'amélioration de ces ressources peut commencer par une meilleure évaluation de la teneur en matière sèche et de la valeur nutritionnelle des fourrages. Actuellement, le temps du processus analytique est souvent long et les analyses ne sont pas régulières, alors que la qualité du fourrage évolue dans le temps. Pouvoir analyser les fourrages directement à la ferme permettrait d'adapter l'alimentation des animaux en fonction de la variabilité de ce fourrage afin d'améliorer la rentabilité de la ferme.
Objectifs. L'objectif est de proposer des solutions d'analyses rapides, in situ, pour mieux caractériser la teneur en matière sèche et la composition chimique des fourrages pour évaluer leur valeur alimentaire.
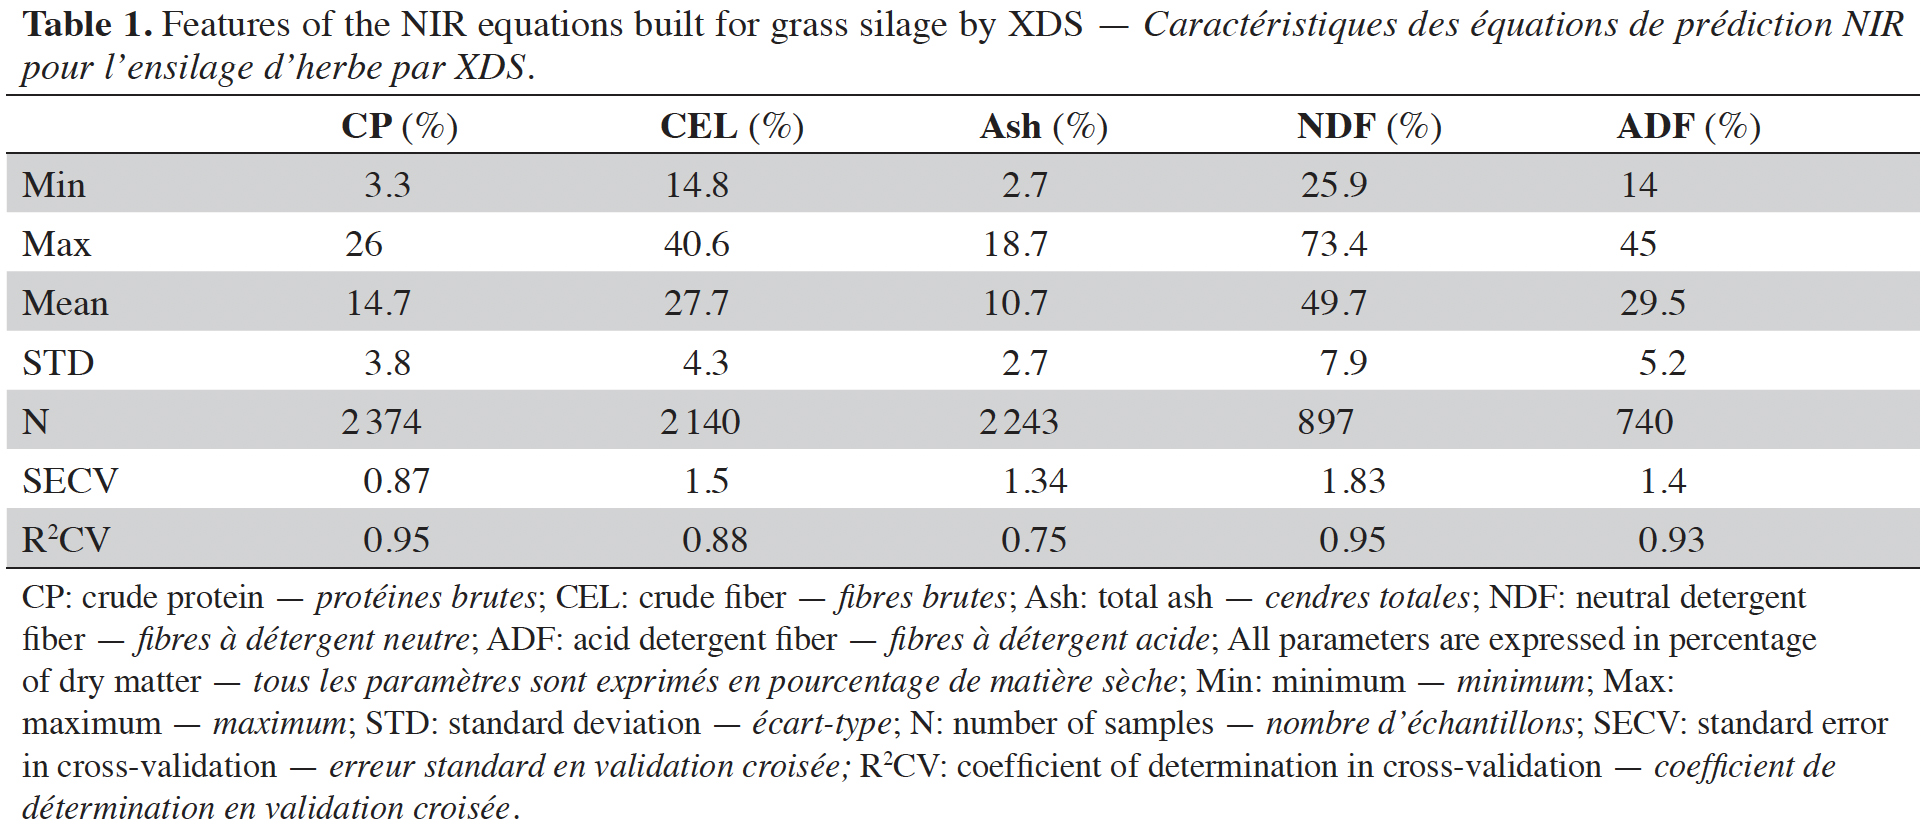
Méthode. Les performances de trois spectromètres portables récemment développés, à savoir le Viavi MicroNIR 1700, l'Ocean Insight FlameNIR et le Malvern Panalytical ASD FieldSpec 4, sont évaluées pour prédire la teneur en matière sèche et la composition chimique de l'ensilage frais et non broyé d'herbe, dans le cadre de l’alimentation de précision.
Résultats. Dans l'état actuel de la recherche, ces appareils portables permettent au producteur laitier d'obtenir une prédiction quantitative relativement précise de la teneur en matière sèche et en fibre brute (2,5 % et 1,8 % respectivement en termes de ratios entre l'erreur NIR sur fourrage frais et l'erreur de la méthode de référence) afin d'adapter l'alimentation du cheptel bovin laitier. Les protéines brutes, même si la précision est plus faible (6,4 %), sont quand même bien prédites. Des erreurs plus élevées sont obtenues pour les cendres (9,2 %) et pour les fibres insolubles dans les détergents neutres (6,8 %) et acides (6,9 %).
Conclusions. Les dispositifs étudiés doivent permettre à l'éleveur d'obtenir une prédiction quantitative relativement précise de ces paramètres de qualité afin d'adapter directement la quantité de fourrage distribuée aux animaux. Ces performances pourraient probablement être améliorées en incluant plus d'échantillons/spectres dans les bases de données.
Abstract
Description of the subject. Feed is the main variable cost in dairy farming. More efficient use of forage resources is one way to reduce production costs. Improving forage resource efficiency can start with a better assessment of the dry matter content and nutritional value of forages. Currently, analytical process time is often long and analyses are not repeatable while the quality of the fodder changes over time. Being able to analyze forages directly on-farm would make it possible to adapt the animal diet according to forage variability, in order to improve the profitability of the farm.
Objectives. To propose in situ rapid analysis solutions to better characterize dry matter content and the chemical composition of fodder for assessing its feeding value.
Method. The performance of three recently developed spectroscopic handheld devices, namely the Viavi’s MicroNIR 1700, the Ocean Insight’s FlameNIR and the Malvern Panalytical’s ASD FieldSpec 4, are evaluated to predict dry matter content and the chemical composition of fresh and unground grass silage in the framework of precision feeding and compared to the reference benchtop Foss’s XDS instrument. The conventional global PLS and local PLS are used as multivariate calibration methods.
Results. The assessed handheld devices allow the dairy farmer to obtain a relatively precise quantitative prediction of the dry matter and crude fiber content (2.5% and 1.8% respectively on average, in terms of ratios between the local PLS error on fresh forage and the reference method error) in order to adapt the livestock diet. Crude protein, even if the prediction accuracy is lower (6.4%), is still well predicted. Higher errors are obtained for ash (9.2%), crude neutral (6.8%) and acid detergent fiber (6.9%).
Conclusions. The studied devices should allow the dairy farmer to obtain a relatively precise quantitative prediction of those quality parameters in order to directly adapt the quantity of forage distributed to the animals. Performances could probably be improved by including more samples/spectra into the databases.
Table des matières
Received 21 January 2022, accepted 6 September 2022, available online 18 October 2022.
This article is distributed under the terms and conditions of the CC-BY License (http://creativecommons.org/licenses/by/4.0)
1. Introduction
1Forages contribute largely to the self-sufficiency of both dairy and suckling farms. In the current context of the price volatility of feedstuffs and concentrates, it is essential to characterize forage quality to minimize production costs. Knowledge of the forage’s quality is also essential to meet animal requirements while controlling the environmental impact (Minet et al., 2021). Since the seventies, near-infrared spectroscopy (NIRS) has been recognized as a tool for predicting the quality of forage (Norris et al., 1976; Deaville & Flinn, 2000; Baeten et al., 2016; Debode et al., 2021). Traditionally forage databases have been built from dried and ground samples using laboratory benchtop instruments (Decruyenaere et al., 2006), constituting libraries that can be considered as references on the topic of animal feeding. In recent years, spectral databases generated with handheld devices have been collected. Berzaghi et al. (2021) have recently shown that handheld instruments may provide an alternative to expensive laboratory equipment by providing sufficiently accurate predictions for dry and ground samples. Although NIRS is a non-destructive method and is environment friendly, the pre-processing of samples (drying and grinding) is time consuming and does not encourage carrying out several analyses during the winter season (Murphy et al., 2022). According to Wilkinson et al. (2014), grazed grass samples should be analyzed at least once a week to adjust diet according to the variability of grass quality. Grass silages are heterogeneous forages. Heterogeneity is caused by the variety of plant species in the sward, date of cut, number of cuts and grass fertilization, along with many other factors. Due to less intensive labor requirements and greater cost efficiency, the analysis of fresh silage by NIRS makes it possible to increase the frequency of measurements and could be useful in the framework of precision livestock farming. With regard to conventional benchtop NIRS instruments, Sinnaeve et al. (1994) and Park et al. (1998) have shown the potential of NIR analyses of fresh materials to determine the chemical composition and digestibility of grass silages. According to Cozzolino & Labandera (2002), NIRS of fresh samples can predict dry matter (DM) and crude protein (CP) content of forages with calibration errors of 1.2% and 1.9%, respectively (in terms of SEC – Standard Error of Calibration). The potential of NIRS applied on fresh samples was confirmed by Alomar et al. (2009), Parrini et al. (2019), Lobos et al. (2019) and Murphy et al. (2019 and 2022). More recently, handheld NIR spectrometers were developed for rapidly predicting the DM content and the chemical composition of forages (Bell et al., 2018). These miniaturized and mobile instruments allow frequent analyses, with real-time results, that can help the farmer to feed their cattle more efficiently (Fernández Pierna et al., 2010; Bell et al., 2018; Carreira et al., 2021; Minet et al., 2021).
2The objective of this study is to evaluate the efficiency of recent handheld devices for their use on undried and unground grass silages in Wallonia (Belgium). For this purpose, different NIRS calibration models have been constructed to predict accurately the DM content and the chemical composition (CP, total ash [ash], crude fibre [CEL] as well as acid and neutral detergent fiber [ADF and NDF]). To achieve this objective, two different chemometric strategies were used to build calibration models: the use of the conventional Partial Least Squares (global PLS) regression and the use of a local based PLS algorithm (Allegrini et al., 2016; Minet et al., 2019), the local partial least square regression on global PLS scores (LPLS-S) (Shen et al., 2019). Global PLS calibration models have been proven for years to always provide satisfactory results when the relationship between the spectral and reference values is linear and the data are sufficient to cover all possible sources of variability in terms of measurement factors and population source. However, it is usually observed that the accuracy of the global calibration models decreases as complexity of the calibration set increases (Shenk et al., 1997; Berzaghi et al., 2000). To deal with this situation, local approaches can be used to develop individual calibration models for each unknown sample to be predicted by selecting similar spectra from a large spectral library through distance or correlation.
3The novelty of this work is twofold. Firstly, fresh grass silage was measured directly on the farm with handheld NIR spectrometers, and their performances were compared to a benchtop spectrometer, which was used for reference analysis. Secondly, an alternative chemometric strategy based on local models was compared to the classical PLS. Spectral datasets for dry and ground samples are already available for the benchtop spectrometer, which can be used to have a first idea of the performances that can be reached.
2. Materials and methods
2.1. Grass silage samples
4For this study, 181 samples of grass silage were collected between 2018 and 2020 in 60 different silos in Wallonia (Belgium): 65 samples from nine silos in 2018, 84 samples from 33 silos in 2019 and 32 samples from 18 silos in 2020. The sampling protocol is based on Decruyenaere et al. (2006) and consisted of taking five grass silage samples on the front of the silo following a straight line from the top left to the bottom right, with the aim of covering as much variability as possible. A core drill was used to extract samples from inside the silo. Per silo, five subsamples were gathered and homogenized.
2.2. Instrumentation
5Three portable systems were used in this study, namely the ASD FieldSpec 4 (Malvern Panalytical), the MicroNIR 1700 (Viavi) and the FlameNIR (Ocean Insight) spectrometers.
6The Malvern Panalytical’s ASD FieldSpec 4 instrument covers the visible NIR (VNIR) and the short-wave infrared (SWIR) ranges (350 – 2,500 nm), with a spectral resolution of 3 nm in the VNIR and 8 nm in the SWIR range. The main advantage of this system is its large wavelength range. The device contains an ASD Contact Probe designed for contact measurements of solid raw materials, such as silages. The sample area measured at approximately 1 cm2 per acquisition point (Malvern, 2022).
7Viavi’s MicroNIR 1700 is a lightweight near infrared spectrometer that includes Viavi’s high-precision optical coating technology and miniaturization. It combines linear variable filter (LVF) technology, dispersing element and uncooled InGaAs detector, together with a light source, collection optics and electronics. The spectrometer works in the range 908 – 1,676 nm with a spectral resolution of about 6 nm. The measurements are performed in diffuse reflectance mode, in contact to the sample. The sample area measured is approximately 1 cm2 per acquisition point (Viavi, 2022).
8The Ocean Insight’s FlameNIR spectrometer is a combination of the compact flame optical bench and an uncooled InGaAs detector, it is a versatile instrument for shortwave NIR spectroscopy from 939 –1,666 nm with a spectral resolution of approximately 6 nm. The measurements are performed in contact with the sample. The sample area measured is approximately 1 cm2 per acquisition point (Ocean Insight, 2022).
9Moreover, a benchtop spectrometer, namely the XDS (FOSS analytics), was used as reference to verify the performance of the different handheld systems. This instrument operates in reflection mode in the 400 – 2,498 nm range, with a spectral resolution of 2 nm and it averages 10 spectra collected at different locations in a sample cup (rotating sampling device) during analysis. Spectra were collected using the ISIscan Nova software across the original wavelength range. Each spectrum was the average of 32 scans performed on the sample and it was acquired in 66 s. The sample area measured was about 2 cm2 per acquisition point. The number of measurements points increased with the length of the cup (Foss, 2022).
10Figure 1 shows a typical spectrum of forage and the different wavelength ranges of the instruments used in this study.
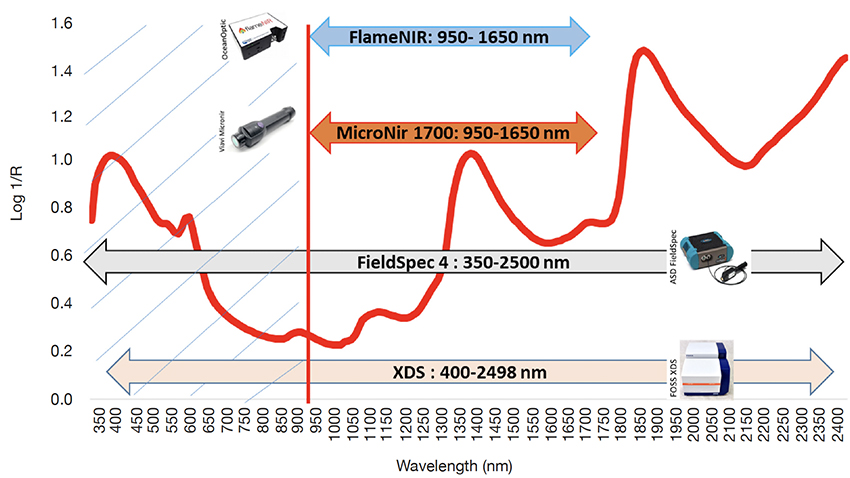 Figure 1. Spectral ranges for the different instruments used in this study — Gammes spectrales pour les différents instruments utilisés dans cette étude.
2.3. NIRS measurement protocol and reference databases
11Samples were measured in fresh, undried and unground states, with the three handheld spectrometers (MicroNIR, FlameNIR and FieldSpec 4). Twenty scans were acquired per sample according to two measurement protocols. In 2018, the protocol consisted of measuring each sample in four different locations, with five replications at each location. However, in 2019 and 2020, the protocol consisted of measuring each sample in 20 different places with only one replication. Fresh samples were also analyzed with a benchtop spectrometer (XDS). In this case, the protocol consisted of measuring five large rectangular cups per sample.
12Samples were then oven dried (48 h, 60 °C) for determining DM (expressed in terms of percentage of fresh material). This value was used as reference value for grass silage DM. Then the samples were ground before NIRS analyses with the benchtop spectrometer. For all the datasets, values obtained by prediction with the XDS, using equations with historical data, on dried and ground samples in quarter cups were used as references values for the handheld spectra. Predicted parameters are CP, CEL, ash, NDF and ADF (according to Van Soest fractions) (Van Soest & Sniffen, 1984) constituents, all of them expressed in percentage of DM). Table 1 shows the performance of those equations used as reference.
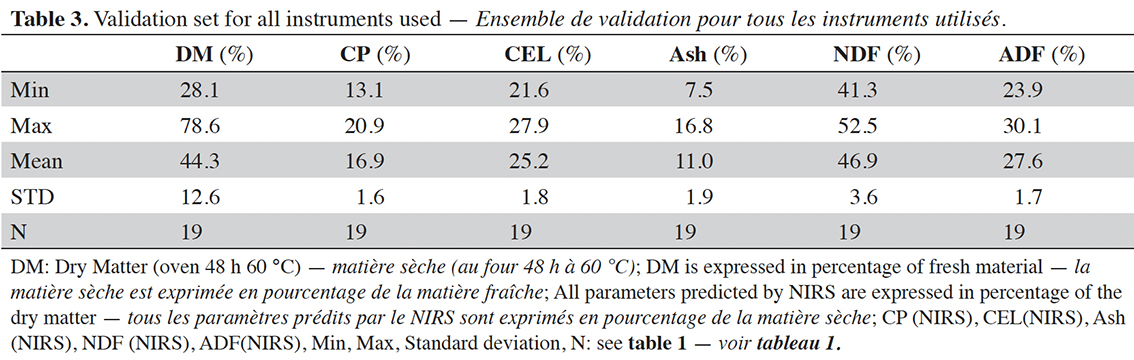
13As not all of the 181 samples were measured on all the devices, a set of 19 validation samples, common for all the instruments, was also obtained from the same period and coming from different silos as in the calibration sets.
2.4. Data treatment and chemometric tools
14Analyses were conducted using the Matlab R2007b (The Mathworks Inc., Natick, MA, USA) and the PLS toolbox 7.0.2. (Wise et al., 2006). The spectra from XDS and FieldSpec 4 were first trimmed from 900 to 2,500 nm. The VNIR range up to 900 nm was removed. The spectra acquired with the four devices were pre-processed by SNV and 1st derivative Savitzky-Golay (window: 5, polynomial: 2).
15Chemometric tools comprised the building of calibration models using the conventional Partial Least Squares (global PLS) regression as well as the use of a local based PLS algorithm (Allegrini et al., 2016; Minet et al., 2019), the local partial least square regression on global PLS scores (LPLS-S) (Shen et al., 2019). LPLS-S is based on the principle of replacing the original spectra with a global PLS score matrix. In this local based method, for each new spectrum to be predicted, a number of nearest neighbors are selected in the calibration set by calculating the lowest Euclidean distances between the scores of each unknown sample and those of the available database. After the neighbors have been defined, a calibration model is performed by PLS regression only on those spectra. As explained by Shen et al. (2019), as local based algorithms need to establish an analysis model for each sample to be predicted, the idea of replacing the spectra by the global PLS scores is done with the aim of increasing the speed of the calculations, which can be an important parameter for on-line applications, especially when implemented on large databases.
2.5. Statistical analyses
16One way to evaluate performance is to compare the PLS prediction results for each device with the error obtained when working in the classical way based on dry and ground samples. The standard error of calibration (SECV) obtained for the dry samples measured with the XDS device gives us an idea of the performances obtained until now for grass silage. However, it should be noted that it is not relevant to evaluate the performance of devices via the standard errors of the NIRS equations calibration because the data sets are not the same between each device. It is therefore better to evaluate these models on the basis of the validation set, namely the standard error of prediction (SEP).
17In order to take into account the difference with the SECV and the standard error of laboratory (SEL), a difference must be established between the error predicted by the model (SEPobserved) and the real prediction error (SEPactual). This SEPactual is estimated for each device using the following equation (Faber & Kowalski, 1996):
18SEP2actual = SEP2observed – (SECV2dry – SEL2) (eq. 1)
19where SEPobserved: Standard Error of Prediction (estimated on the validation set, on fresh samples); SEPactual: real SEP according to eq.1; SECV: Standard Error of Cross-Validation (estimated on the calibration set, on dry and ground samples) and SEL: Standard Error of Laboratory (reference analysis).
3. Results
3.1. Sample variability
20As indicated at the 2.3 section, two different protocols were used for the 2018 and the 2019/2020 periods. This was done in order to better take into account the sample variability against the instrument variability. That was demonstrated by performing a Principal Component Analysis (PCA) on the spectra (Figure 2), which shows four different clusters of five points when using the 1st protocol and no cluster at all when using the 2nd protocol.
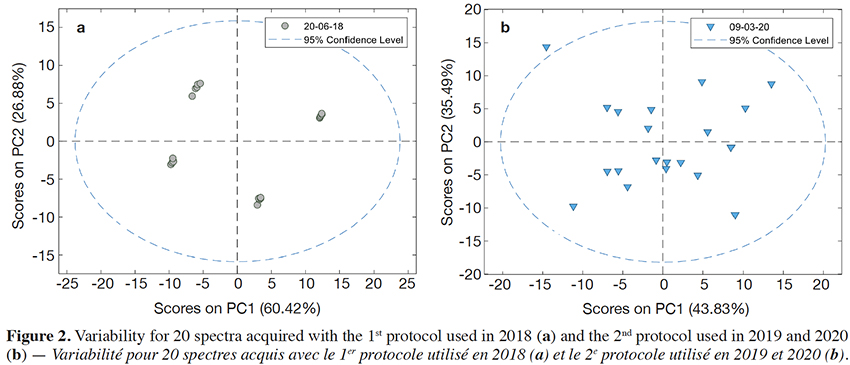 Figure 2. Variability for 20 spectra acquired with the 1st protocol used in 2018 (a) and the 2nd protocol used in 2019 and 2020 (b) — Variabilité pour 20 spectres acquis avec le 1er protocole utilisé en 2018 (a) et le 2e protocole utilisé en 2019 et 2020 (b).
3.2. Descriptive statistics
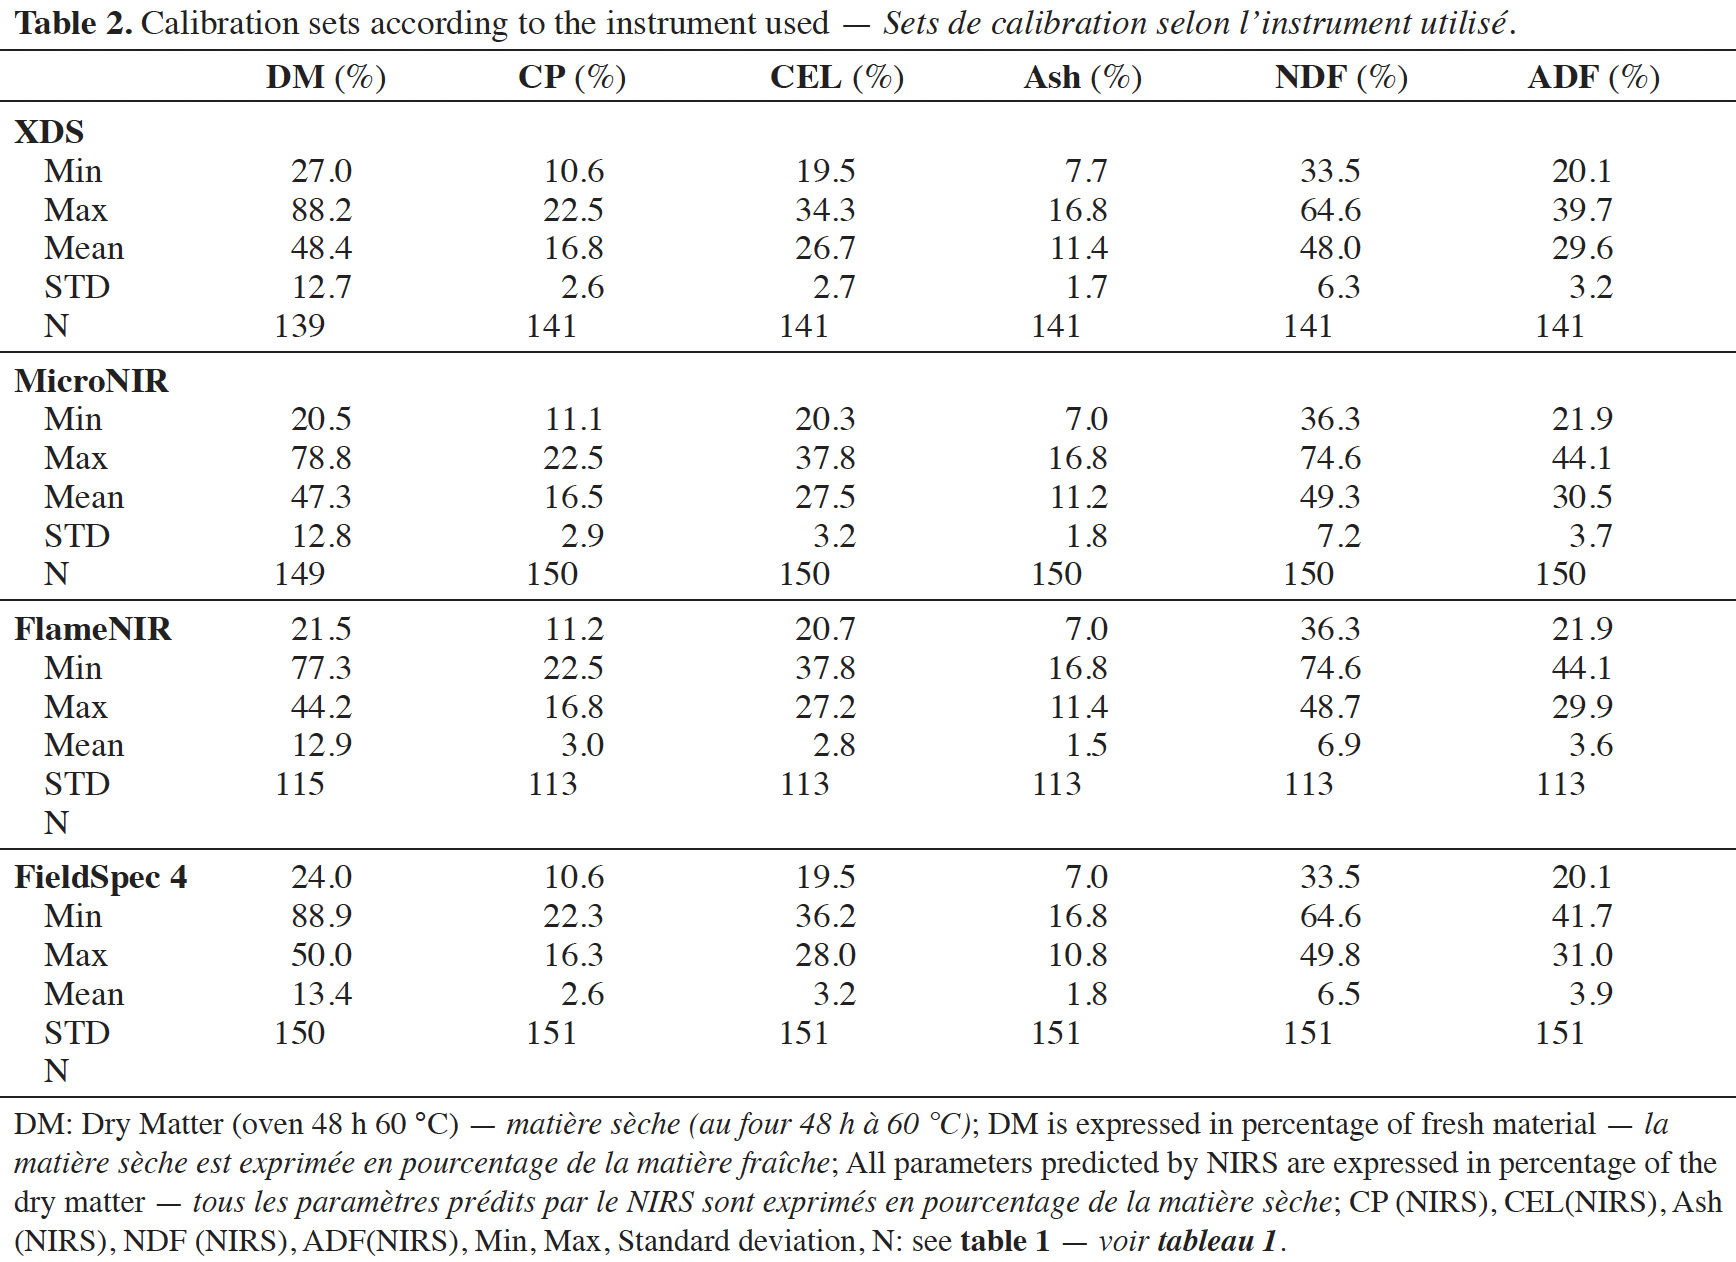
21The spectral databases used to build the models (Table 2) differ slightly as not all samples were measured on all handheld devices. However, these databases are similar in terms of their size and the characteristics of their parameters in terms of mean and standard deviation. However, for the validation, the same dataset is used for all devices (Table 3).
3.3. Performances of handheld spectrometers
22Figure 3 shows, for the four devices, the performance results in terms of SEPobserved for all parameters predicted using PLS and local PLS models.
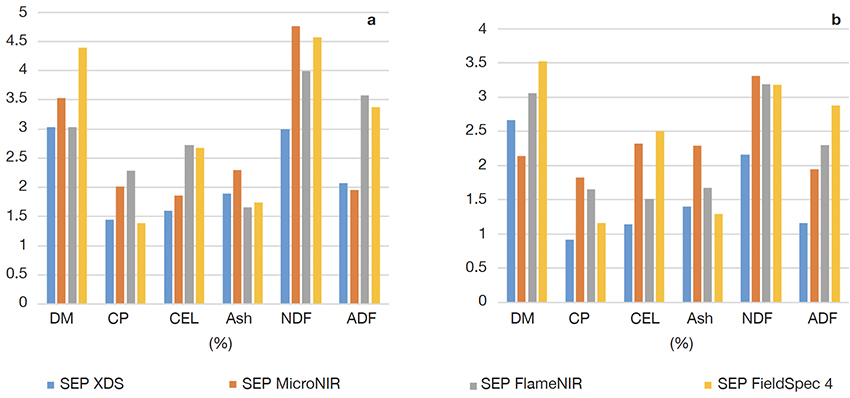 Figure 3. Results in terms of Standard Error of Prediction SEPobserved for (a) PLS and (b) local PLS — Résultats en termes d’erreur standard de prédiction SEPobserved pour (a) PLS et (b) PLS locale.
DM: dry matter — matière sèche; CP, CEL, Ash, NDF, ADF: see table 1 — voir tableau 1.
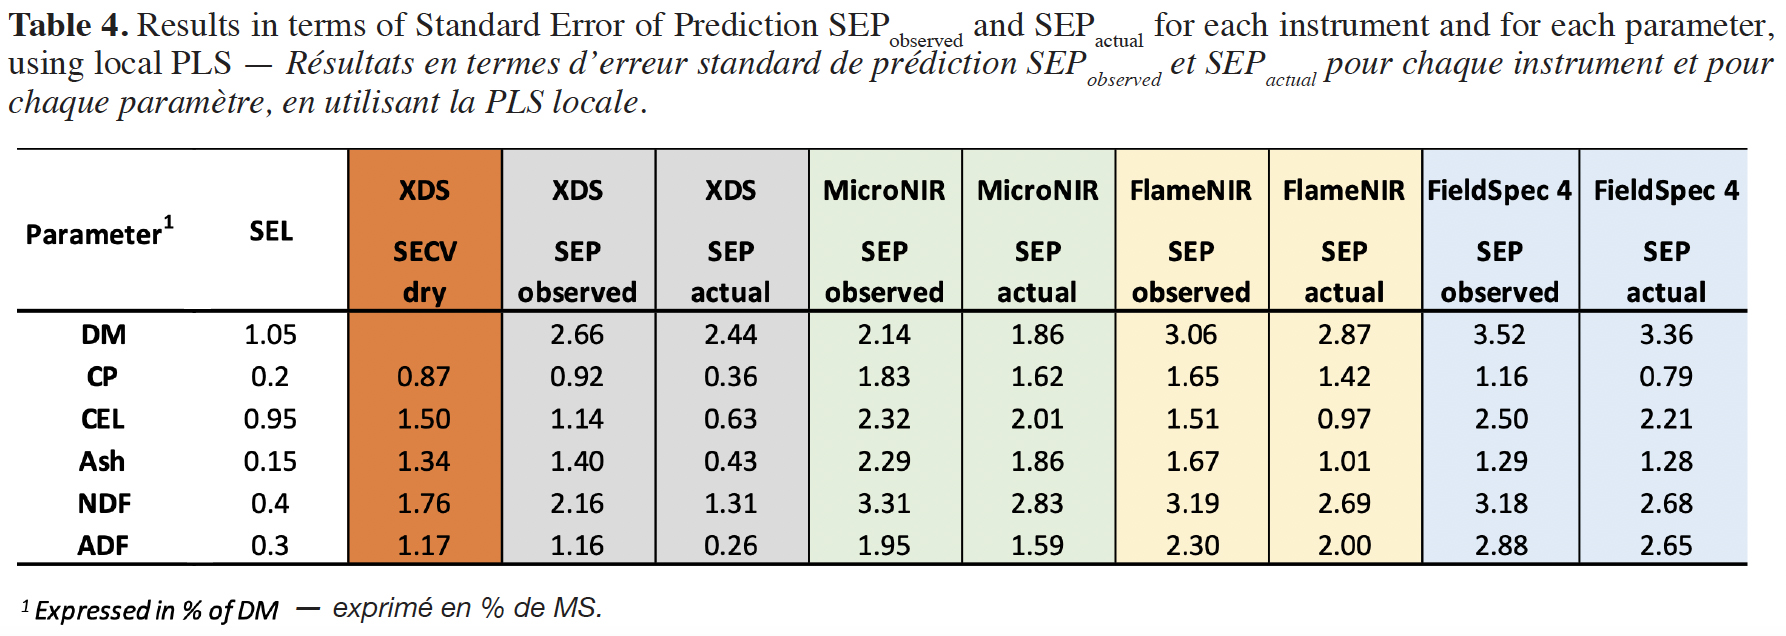
23Table 4 shows the SEL, the SECV obtained on ground and dry samples, as well as the SEPobserved and the SEPactual values (calculated using eq. 1) obtained on fresh samples for each parameter and for each instrument, using local PLS.
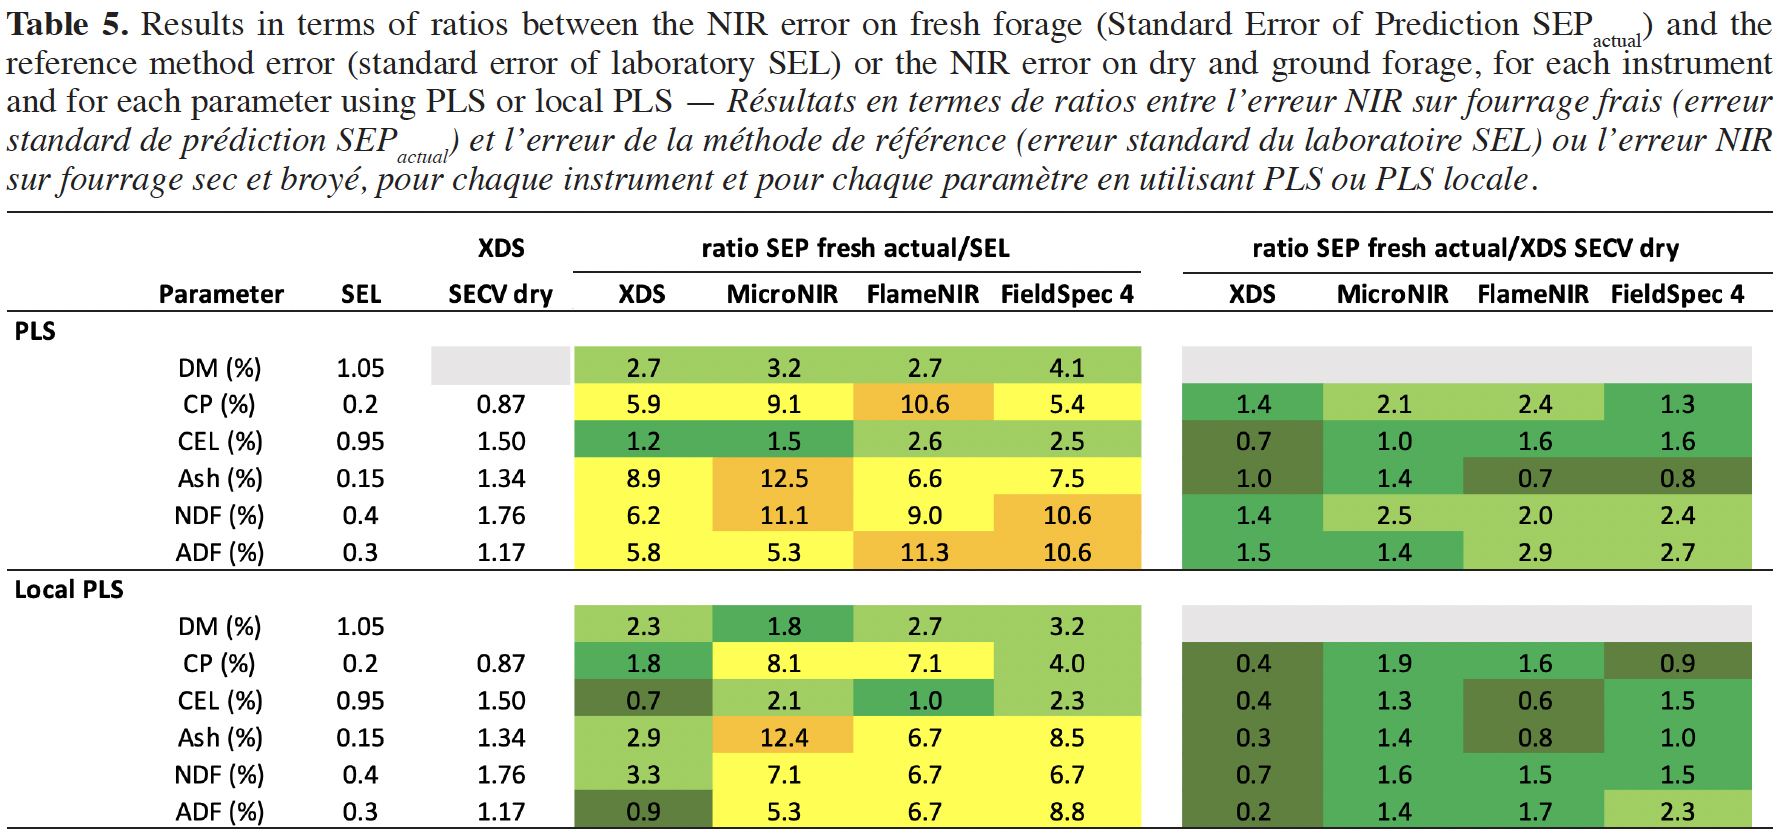
24To better understand the errors obtained based on the type of instrument and the data processing technique (PLS and local PLS) used, two ratios have been calculated. The first ratio is built, for each instrument, between the NIR error on fresh forage (SEPactual) and the reference method error (SEL) and the second ratio is constructed between the NIR error on fresh forage (SEPactual) and the NIR error on dry and ground forage (XDS SECV dry). Table 5 shows the results in terms of both ratios.
4. Discussion
25In general and as observed in figure 2, for all tested parameters, the best SEPobserved values were obtained for local PLS models. As expected, the XDS had the best prediction of chemical composition of forages. However, for some cases, even better results were obtained with some of the handheld devices.
26For the PLS calibrations (Figure 2a), it was observed that some handheld devices had a lower prediction error or equivalent to the benchtop device (XDS) for dry matter (DM), crude protein (CP), total ash (Ash) and acid detergent fiber (ADF). The FlameNIR has a lower SEPobserved (1.66% vs 1.89%) for ash and equivalent to the benchtop instrument for the DM parameter (3.03%). The FieldSpec 4 also has a lower SEPobserved than the XDS for ash (1.74% vs 1.89%) and crude protein (1.38% vs 1.45%). The MicroNIR on the other hand has a lower SEPobserved than the XDS for the ADF parameter (1.95% vs 2.07%).
27For the local PLS models (Figure 2b), for DM, the SEPobserved value of MicroNIR (2.14%) appeared lower than XDS (2.66%). CP content was well predicted by all handheld spectrometers (SEPobserved values < 2%), with the FieldSpec 4 showing the best performance (1.16%) compared to the other systems (1.83% for MicroNIR and 1.65% for FlameNIR) and close to the XDS value (0.92%). In the case of CEL, the FlameNIR presented the best performance (1.51%). In the case of ash content, both FieldSpec 4 (1.29%) and FlameNIR (1.67%) showed similar or better results than XDS (1.4%). It appeared difficult to predict NDF fraction with a good accuracy with handheld spectrometers, being the FieldSpec 4 the one showing a lower performance (3.18%) but still far from the XDS (2.16%). In the case of ADF, the best performance is obtained with MicroNIR (1.95%) but lower than the one obtained with XDS (1.16%).
28As observed in table 4, the SEPactual are lower than the SEPobserved. For the benchtop XDS device, those values are higher than the SEL values but lower than the SECV values on dry samples. For most of the parameters, those values are also lower than the ones obtained with the handheld instruments. For the latter devices, the lower SEPactual is obtained for DM and ADF using the MicroNIR, CEL and ash using the FlameNIR, and CP and NDF using the FieldSpec 4. The higher SEPactual calculated for protein using FlameNIR and MicroNIR can be explained by the wavelength range limited to 1,650 nm, without the protein bands around 2,100 nm.
29It can be observed that the models using local PLS (Table 5) allow to reduce the errors on fresh forage and that these errors are at the same level as the NIR error on dry and ground samples. Based on the XDS models, this error is even two times lower with a ratio from 0.2 to 0.7 depending on the parameter. In comparison to the SEL, the SEPactual error is 0.7 to 3.3 times higher using the XDS. For the handheld instruments, this error is around two times higher for DM and CEL and more than five times higher for the other parameters except for CP using the FieldSpec 4 device.
30As expected, in general, performances are lower when working with fresh and unground samples compared to classical analysis (dry and ground samples and benchtop spectrometer). However, in the current state of this research, these handheld devices allow the dairy farmer to obtain an adequate quantitative prediction of the dry matter, CEL and ashes in order to directly adapt the quantity of forage distributed to the animals. CP content was well predicted by all handheld spectrometers. Higher errors were obtained for NDF and ADF in comparison to the reference method.
31Two major difficulties were encountered in this type of on-farm analysis. The first concerns the heterogeneity of the samples. It is therefore essential to set up a correct measurement protocol that allows sufficient representativeness of the sample; this has been done by multiplying the number of measurements to 20, which means that an area of more or less 20 cm2 is measured for each sample. The second difficulty concerns the high water content of the “fresh” samples that has the effect of inducing a high prediction error for all the parameters other than the dry matter. This is because the water strongly absorbs the near infrared radiation and then the other chemical constituents of the fodder are masked. This effect has been already highlighted in several studies dealing with feed and food products (Reeves, 1994; Büning-Pfaue, 2003; Giordanengo et al., 2008; Zhang et al., 2018; Evangelista et al., 2021; Mallet et al., 2021). A qualitative approach is under development for these parameters. Moreover, these performances can be probably improved by including more samples/spectra into the databases and by applying new validation sets covering a large majority of the variation present in the calibration sets for these parameters, which is not the case in the present study (Au et al., 2020; Ng et al., 2020).
5. Conclusions
32Thanks to technological developments, there is now a new range of handheld analyzers that offer interesting potential for direct use on the farm, either by the breeder or by his advisers. One of the objectives of this study was to validate these rapid analysis devices making it possible to determine the dry matter and chemical composition of forages in order to better assess their nutritional value. The advantages of such an approach are from one side to drastically reduce the response time during the analysis and from the other side to allow a better adaptation of the diets by the breeder by performing forages analysis on a more regular basis. This study consisted of evaluating three handhelds near infrared spectrometers for the analysis of grass silages. In order to assess the quality of forage on a regular basis, setting up a complete sampling plan is essential. The sampling step is probably the most important source of errors when estimating the value of a forage. In a perspective future work, an interesting alternative could be the use of fusion data methods in order to combine spectra from all the available instruments and study the advantages of transferring historical datasets from the classical NIR instrument to the handheld devices.
Acknowledgements
33This study was realised in the framework of the Effort project (2018-2022) funded by the CRA-W. More information on https://www.cra.wallonie.be/en/effort-2. The authors wish the technicians who conducted the samples collected in the farms in Wallonia as well as NIR analyses on farms and in laboratory: Stéphane Brichard, Nicolas Crasset, Sophie Mathieux, Sandrine Mauro, Laurent Pierret and Benoît Scaut (CRA-W).
Bibliographie
Allegrini F. et al., 2016. Regression models based on new local strategies for Near Infrared Spectroscopy. Anal. Chim. Acta, 933, 50-58, doi.org/10.1016/j.aca.2016.07.006
Alomar D. et al., 2009. Prediction of the composition of fresh pastures by near infrared reflectance or interactance-reflectance spectroscopy. Chil. J. Agric. Res., 69, 198-206, doi.org/10.4067/s0718-58392009000200009
Au J. et al., 2020. Sample selection, calibration and validation of models developed from a large dataset of near infrared spectra of tree leaves. J. Near Infrared Spectrosc., 28(4), 186-203, doi.org/10.1177/0967033520902536
Baeten V. et al., 2016. Near infrared spectroscopy for food and feed: a mature technique. NIR news, 27(1), 4-6, doi.org/10.1255/nirn.1573
Bell M., Mereu L. & Davis J., 2018. The use of mobile near-infrared spectroscopy for real-time pasture management. Front. Sustainable Food Syst., 2, 76, doi.org/10.3389/fsufs.2018.00076
Berzaghi P., Shenk J.S. & Westerhaus M.O., 2000. LOCAL prediction with near infrared multi-product databases. J. Near Infrared Spectrosc., 1(8), 1-9, doi.org/10.1255/jnirs.258
Berzaghi P., Cherney J.H. & Casler M.D., 2021. Prediction performance of portable near infrared reflectance instruments using preprocessed dried, ground forage samples. Comput. Electron. Agric., 182, 106013, doi.org/10.1016/j.compag.2021.106013
Büning-Pfaue H., 2003. Analysis of water in food by near infrared spectroscopy. Food Chem., 82(1), 107-115, doi.org/10.1016/s0308-8146(02)00583-6
Carreira E. et al., 2021. Real-time quantification of crude protein and neutral detergent fibre in pastures under montado ecosystem using the portable NIR spectrometer. Appl. Sci., 11, 10638, doi.org/10.3390/app112210638
Cozzolino D. & Labandera M., 2002. Determination of dry matter and crude protein contents of undried forages by near-infrared reflectance spectroscopy. J. Sci. Food Agric., 82, 380-384, doi.org/10.1002/jsfa.1050
Deaville E.R. & Flinn P.C., 2000. Near-infrared (NIR) spectroscopy: an alternative approach for the estimation of forage quality and voluntary intake. In: Givens D.I., Owens E., Axford R.F.E. & Omed H.M., eds. Forage evaluation in ruminant nutrition. Oxon, UK: CABI, 301-320, doi.org/10.1079/9780851993447.0301
Debode F. et al., 2021. Developments in analytical techniques for testing animal feed. In: Partheeban N., ed. Developing animal feed products. Cambridge, UK: Burleigh Dodds Science Publishing, 79-122.
Decruyenaere V. et al., 2006. Qualité du fourrage en Région Wallonne. Gembloux, Belgique : Requasud, 1-32.
Evangelista C., Basiricò L. & Bernabucci U., 2021. An overview on the use of near infrared spectroscopy (NIRS) on farms for the management of dairy cows. Agriculture, 11(4), 296, doi.org/10.3390/agriculture11040296
Faber K. & Kowalski B.R., 1996. Multivariate detection limits with fixed probabilities of error. Chemom. Intell. Lab. Syst., 34, 283-292
Fernández Pierna J.A., Vermeulen P., Lecler B. & Baeten V., 2010. Calibration transfer from dispersive instruments to handheld spectrometers. Appl. Spectrosc., 64(6), 644-648, doi.org/10.1366/000370210791414353
Foss analytics, 2022. https://www.fossanalytics.com/en/news-articles/feed-and-forage/nir-instrument, (26/04/2022).
Giordanengo T. et al., 2008. Correction of moisture effects on near infrared calibration for the analysis of phenol content in eucalyptus wood extracts. Ann. For. Sci., 65(8), 803, doi.org/10.1051/forest:2008065.
Lobos I., Moscoso C.J. & Pavez P., 2019. Calibration models for the nutritional quality of fresh pastures by near-infrared reflectance spectroscopy. Cienc. Investig. Agrar., 46(3), 234-242, doi.org/10.7764/rcia.v46i3.2020
Mallet A. et al., 2021. Unveiling non-linear water effects in near infrared spectroscopy: a study on organic wastes during drying using chemometrics. Waste Manage., 122(1), 36-48, doi.org/10.1016/j.wasman.2020.12.019
Malvern Panalytical, 2022. https://www.malvernpanalytical.com/en/products/product-range/asd-range/fieldspec-range/fieldspec4-hi-res-high-resolution-spectroradiometer, (26/04/2022).
Minet O. et al., 2019. Local vs global methods applied to large near infrared databases covering high variability. In: Engelsen S.B., Sørensen K.M. & van den Berg F., eds. Proccedings of the 18th International Conference Near Infrared Spectroscopy, Denmark. Chichester, UK: IM Publications Open, 45-49, doi.org/10.1255/nir2017.045
Minet O., Decruyenaere V., Godin B. & Baeten V., 2021. Application of NIR spectroscopy to the analysis of forages. In: Ciurczak E.W., Igne B., Workman J. & Burns D.A., eds. Handbook of Near Infrared Analysis. 4th ed. Boca Raton, FL, USA: CRC Press, 583-602.
Murphy D.J. et al., 2019. A preliminary near infrared spectroscopy calibration for the prediction of un-dried fresh grass quality. In: O’Brien B., Hennessy D. & Shalloo L., eds. Proceedings of the 9th European Conference Precision on Livestock Farming. Fermoy, Co. Cork, Ireland: Moorepark, Teagasc Animal & Grassland Research and Innovation Centre, 199-204.
Murphy D.J. et al., 2022. A near infrared spectroscopy calibration for the prediction of fresh grass quality on Irish pastures. Inf. Process. Agric., 9(2), 243-253, doi.org/10.1016/j.inpa.2021.04.012
Ng W., Minasny B., de Sousa Mendes W. & Melo Demattê J.A., 2020. The influence of training sample size on the accuracy of deep learning models for the prediction of soil properties with near-infrared spectroscopy data. Soil, 6, 565-578, doi.org/10.5194/soil-6-565-2020
Norris H.K., Barnes R.F., Moore J.E. & Shenk J.S., 1976. Predicting forage quality by near infrared reflectance spectroscopy. J. Anim. Sci., 43, 889-897.
Ocean Insight, 2022. https://www.oceaninsight.com/products/spectrometers/general-purpose-spectrometer/flame-series/FLAME-NIR/, (26/04/2022).
Park R.S., Agnew R.E., Gordon F.J. & Steen R.W.J., 1998. The use of near infrared reflectance spectroscopy (NIRS) on undried samples of grass silage to predict chemical composition and digestibility parameters. Anim. Feed Sci. Technol., 72, 155-167, doi.org/10.1016/s0377-8401(97)00175-2
Parrini S. et al., 2019. Near infrared spectroscopy technology for prediction of chemical composition of natural fresh pasture. J. Appl. Anim. Res., 47(1), 514-520, doi.org/10.1080/09712119.2019.1675669
Reeves J.B., 1994. Effects of water on the spectra of model compounds in the short-wavelength near infrared spectral region (14,000–9091 cm-1 or 714–1100 nm). J. Near Infrared Spectros., 2(4), 199-212, doi.org/10.1255/jnirs.46
Sinnaeve G., Dardenne P., Agneessens R. & Biston R., 1994. The use of near infrared spectroscopy for the analysis of fresh grass silage. J. Near Infrared Spectrosc., 2, 79-84, doi.org/10.1255/jnirs.34
Shen G. et al., 2019. Local Partial Least Square based on global PLS Scores. J. Chemom., 33(5), e3117, doi.org/10.1002/cem.3117
Shenk J.S., Westerhaus M.O. & Berzaghi P., 1997. Investigation of a LOCAL calibration procedure for near infrared instruments. J. Near Infrared Spectrosc., 5(4), 223-232, doi.org/10.1255/jnirs.115
Van Soest P.J. & Sniffen C.J, 1984. Nitrogen fractions in NDF and ADF. In: Proceedings Distillers Feed Conference, Cincinnati, Ohio, USA, 73.
Viavi, 2022. https://www.viavisolutions.com/en-us/osp/products/micronir-1700es, (26/04/2022).
Wilkinson J.M. et al., 2014. Variation in composition of pre-grazed pasture herbage in the United Kingdom, 2006–2012. Anim. Feed Sci. Technol., 196, 139-144, doi.org/10.1016/j.anifeedsci.2014.07.001
Wise B.M., 2006. PLS Toolbox 4.0 for use with MATLAB TM. Wenatchee,WA, USA: Eigenvector Research Inc.
Zhang J., Shuqi L., Mengfei L. & Endian Y., 2018. A near-infrared reflectance spectroscopic method for the direct analysis of several fodder-related chemical components in drumstick (Moringa oleifera Lam.) leaves. Biosci. Biotechnol. Biochem., 82(5), 768-774, doi.org/10.1080/09168451.2018.1445519