


- Accueil
- Volume 26 (2022)
- Numéro 3
- Assessment of the sustainability of small dairy farms in the North of Tunisia


Visualisation(s): 920 (15 ULiège)
Téléchargement(s): 15 (0 ULiège)

Assessment of the sustainability of small dairy farms in the North of Tunisia

Document(s) associé(s)
Version PDF originaleRésumé
Évaluation de la durabilité des petites exploitations laitières dans le Nord de la Tunisie
Description du sujet. La demande de produits animaux augmente en raison de la croissance de la population humaine. Par ailleurs, le changement climatique constitue une menace majeure pour la viabilité et la durabilité des systèmes de production animale, qui font l’objet de nombreux débats.
Objectifs. Cette étude vise à évaluer la durabilité des exploitations laitières dans le Nord de la Tunisie.
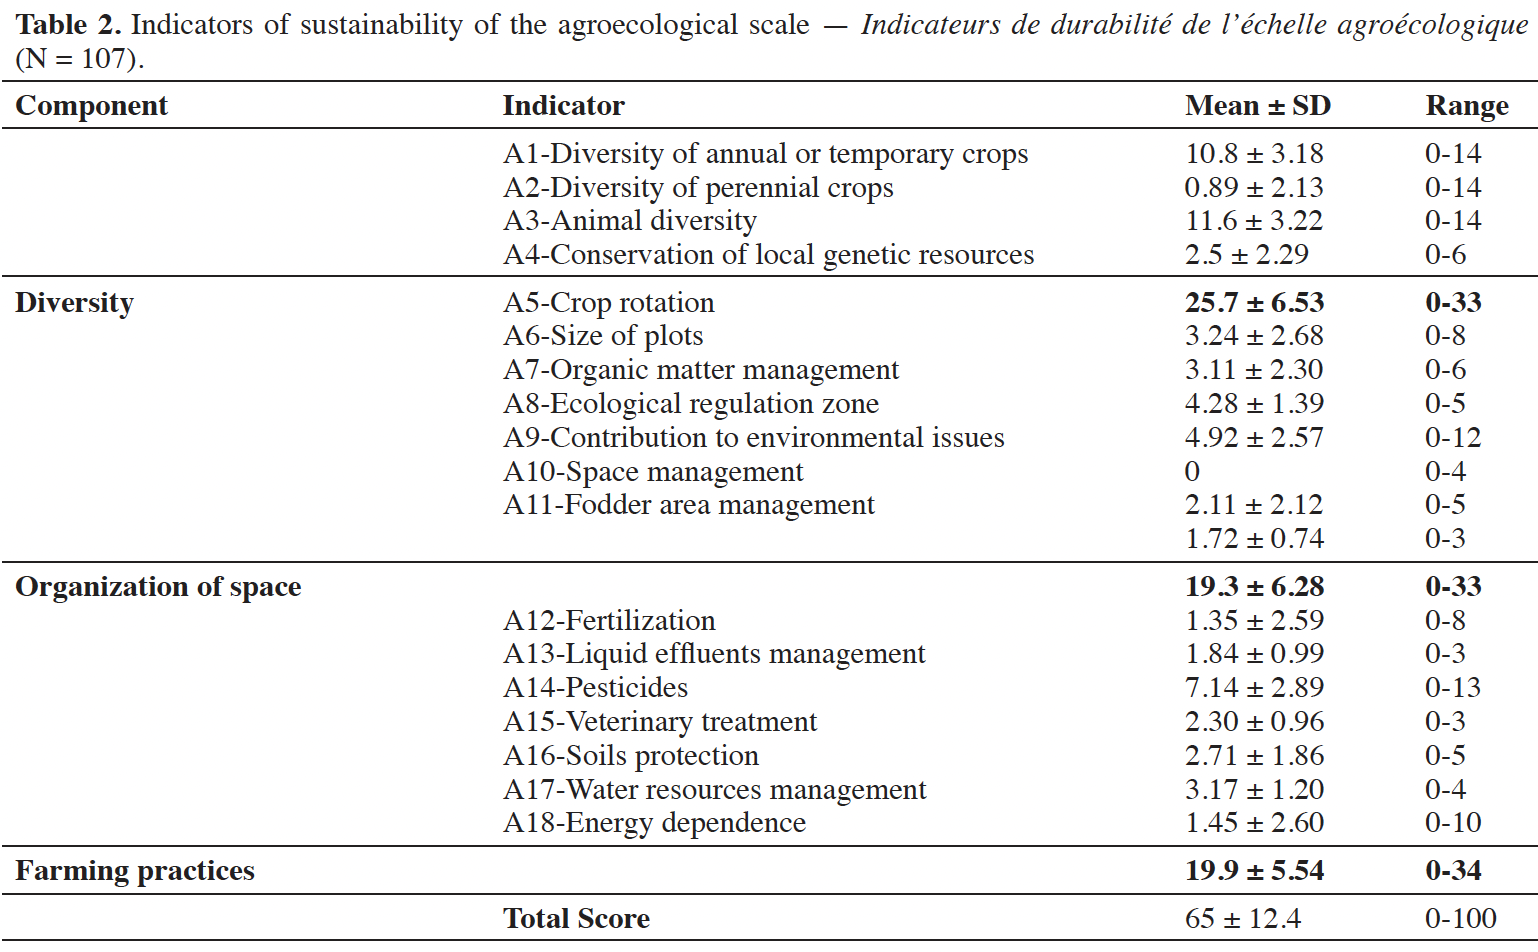
Méthode. Les scores de durabilité ont été calculés sur la base d’entretiens individuels menés dans 107 exploitations d’élevage de vaches laitières via un outil basé sur des indicateurs couvrant les trois dimensions de la durabilité (agroécologique, socio-territoriale et économique). Il permet une évaluation quantitative des exploitations agricoles simultanément sur trois échelles. Le questionnaire englobe ces trois échelles de durabilité, et chaque échelle est composée d’un ensemble d’indicateurs. Ces indicateurs sont alignés avec les objectifs et l’échelle d'analyse, fiables et simples à comprendre et intègrent des variables pour être facilement mesurés. Le score final de la durabilité correspond à la valeur la plus faible de ces trois échelles. Cette analyse est associée aux analyses statistiques ACP (Analyse en Composantes Principales) et CAH (Classification Ascendante Hiérarchique) pour classer les exploitations en groupes selon le score final.
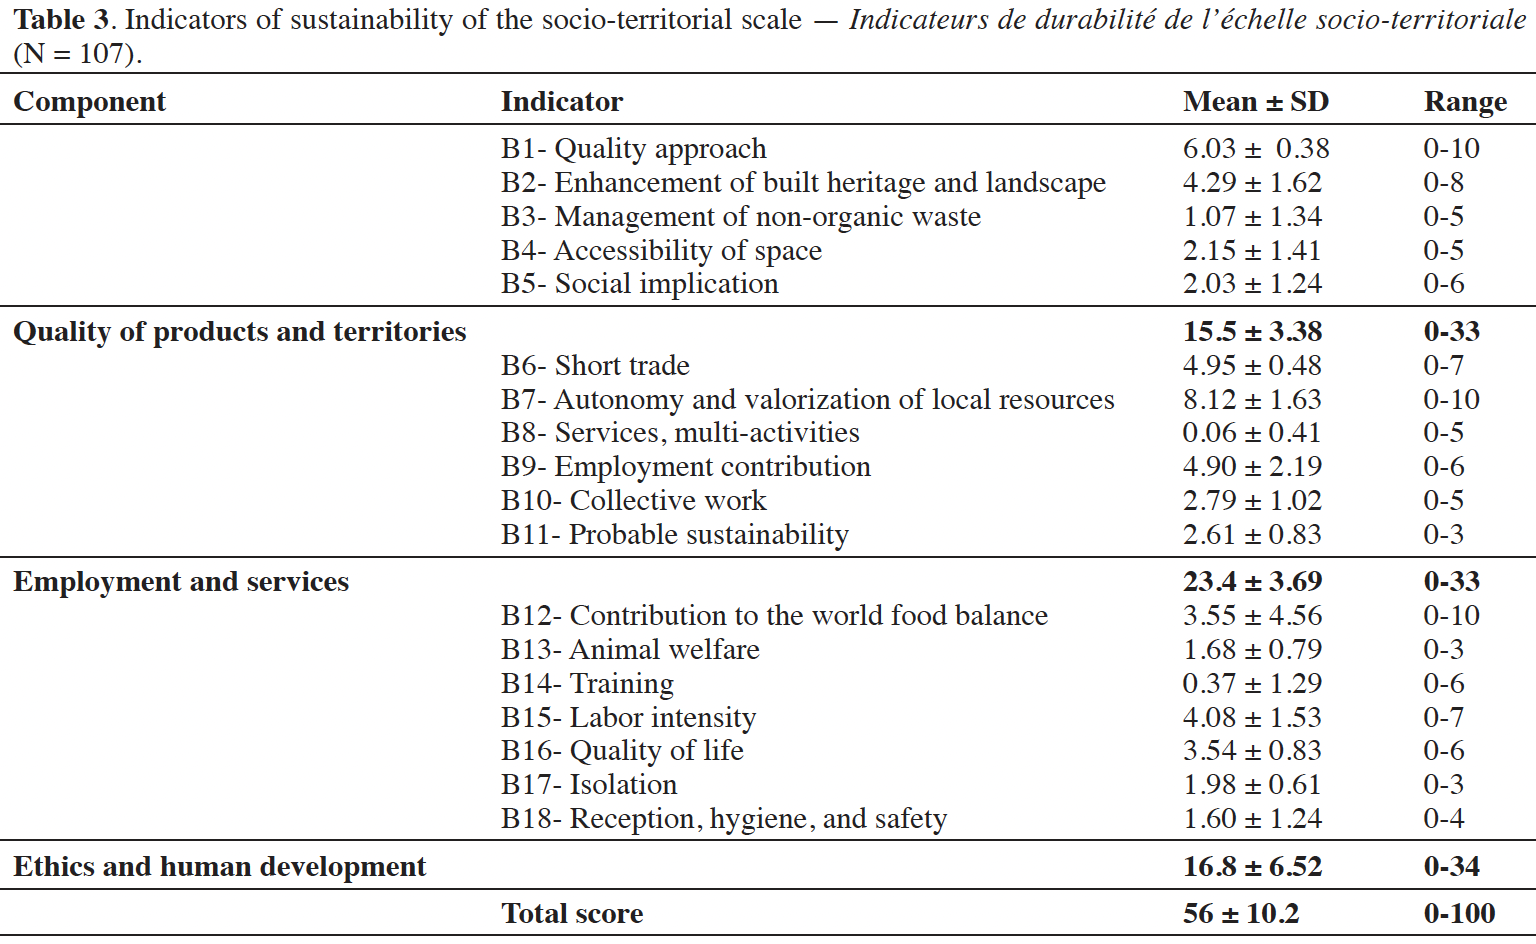
Résultats. Les résultats moyens de l’évaluation de la durabilité montrent que les performances les plus élevées sont enregistrées pour les échelles agroécologique (65 points) et économique (63 points), alors que la dimension socio-territoriale pénalise la durabilité totale des exploitations (56 points). L’analyse descriptive de la méthode IDEA fournit une image représentative de la durabilité des petites exploitations laitières tunisiennes du Nord. Les analyses des données en ACP et CAH ont permis d’identifier quatre groupes de systèmes d’élevage selon les composantes de la durabilité. Le premier est représenté par les exploitations les moins durables. Le deuxième regroupe les exploitations ayant une durabilité agroécologique et socio-territoriale acceptable, mais une durabilité économique très faible. Le troisième groupe est composé d’exploitations ayant la meilleure durabilité économique, une durabilité socio-territoriale acceptable mais la durabilité agroécologique est la plus faible. Le quatrième groupe est associé aux exploitations les plus durables sur les trois échelles.
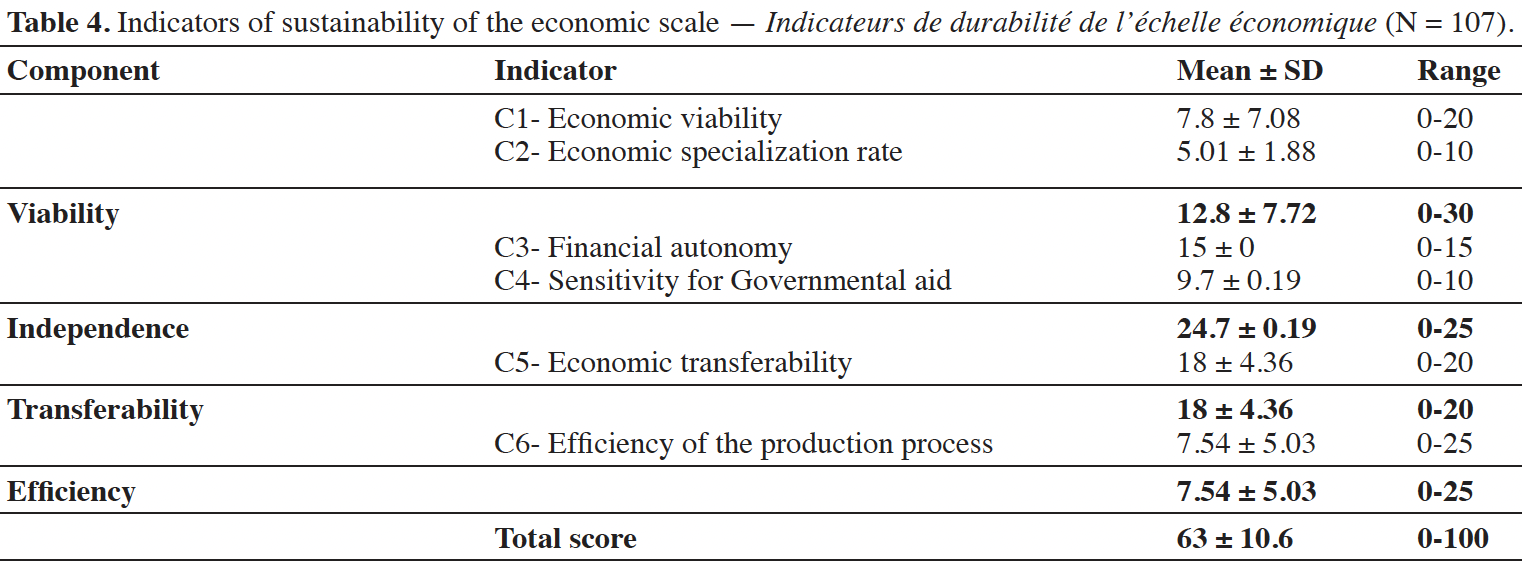
Conclusions. Les résultats globaux montrent qu’il n’y a pas de dissociation entre la durabilité agroécologique, socio-territoriale et économique, et que les améliorations doivent donc se faire simultanément sur les trois échelles.
Abstract
Description of the subject. The demand for animal products is increasing due to human population growth. In addition, climate change poses a major threat to the viability and sustainability of livestock production systems, which are the subject of much debate.
Objectives. This study aims to assess the sustainability of small dairy farms in the North of Tunisia.
Method. Sustainability scores were calculated on the basis of individual interviews conducted on 107 dairy farms using a tool based on indicators covering the three dimensions of sustainability (agroecological, socio-territorial and economic). It allows a quantitative assessment of farms simultaneously on three scales. The questionnaire encompasses these three scales of sustainability, and each scale is composed of a set of indicators. These indicators are aligned with the objectives and scale of analysis, reliable and simple to understand, and incorporate variables for easy measurement. The final sustainability score is the lowest value of these three scales. This analysis is combined with PCA (Principal Component Analysis) and Ascending Hierarchical Classification (AHC), statistical analyses to classify the farms into groups according to the final score.
Results. The average results of the sustainability assessment show that the highest performances are recorded for the agroecological (65 points) and economic (63 points) scales, while the socio-territorial dimension penalizes the total sustainability of the farms (56 points). The descriptive analysis of the IDEA method provides a representative picture of the sustainability of small Tunisian dairy farms in the North. The PCA and AHC analyses of the data allowed the identification of four groups of livestock systems according to the components of sustainability. The first is represented by the least sustainable farms. The second group consists of farms with acceptable agroecological and socio-territorial sustainability, but very low economic sustainability. The third group is made up of farms with the best economic sustainability, acceptable socio-territorial sustainability but the lowest agroecological sustainability. The fourth group is associated with the most sustainable farms at all three scales.
Conclusions. The overall results show that there is no dissociation between agroecological, socio-territorial and economic sustainability, and that improvements must therefore be made simultaneously on all three scales.
Table des matières
Received 25 June 2021, accepted 6 September 2022, available online 20 September 2022
This article is distributed under the terms and conditions of the CC-BY License (http://creativecommons.org/licenses/by/4.0)
1. Introduction
1Agriculture in most parts of the world is characterized by different coexisting forms of farm organization ranging from entrepreneurial to small-family farms (Bosc et al., 2015). Although shifts are observed, family farming is still the most common form of farming in the world (Graeub et al., 2016). Many studies have been conducted to assess the sustainability of farms, which is a major concern particularly in a rapidly changing world (Tilman et al., 2002). Recently, researchers have been using ecological and social approaches to consider the bio- and socio-complexity of the production systems and their diversity, in an attempt to deeply assess the sustainability of livestock systems (Hoffmann, 2013; Flori et al., 2019; Amsidder et al., 2021; Attia et al., 2021). Since its inception, the concept of sustainable agriculture has been defined as an ecologically sound (Lusson & Coquil, 2016; Nori et al., 2017), economically viable (Sarandón, 2002; Alary et al., 2020), and socially fair agriculture that meets human needs (Van Der Ploeg et al., 2019) without degrading natural resources so that it can maintain itself over time (Márquez-Romero et al., 2016; Otta et al., 2016; Peña et al., 2018). In this respect, livestock systems are facing a huge challenge: increasing production to fulfil the increasing demand while maintaining natural resources without reducing agricultural activities (Nardone et al., 2004). The need to properly address this concept of farm sustainability has led to the development of different methods using diverse indicators approaches (Paracchini et al., 2015; Thiollet-Scholtus & Bockstaller, 2015). Various sustainability assessment tools have been developed with different levels of focus (farm, sector, or regional level) and intended end-users (farmers or policymakers) (Van Passel & Meul, 2012).
2In Tunisia, the dairy sector is strategic for national agriculture as it occupies an important position in the economic and social structure. Undeniably, it experienced substantial progress during the 1990-2000 decade by achieving a surplus of production in 1998/1999 and then in 2000/2001 due to several policy reforms to increase milk production and ensure self-sufficiency in milk products. However, in 2002, the dairy sector faced new difficulties regarding low performance and productivity, low or moderate milk quality, high production costs, and dependence on fluctuations in the international price of feed ingredients, which are mainly imported. This situation is aggravated by the low skilling, especially among small farmers who opt for high-performance breeds, especially the Holstein breed (IGRMM, 2015). This critical situation leads to question the sustainability of these farms confronted with such technical, environmental, and economic issues.
3It is in this perspective that this article proposes to evaluate the sustainability of small dairy farms in the Northern region of Tunisia, known as the milk basin.
2. Materials and methods
2.1. Study area and farm sampling
4Bizerte is a governorate in the north of Tunisia (3,750 km²); it is characterized by a mild and humid climate, with an average temperature of 19.9 °C and an average rainfall of 608.8 mm for the year 2018/2019. Dairy cattle farming is the main agricultural activity in Bizerte. The region contributes to milk production by 48% at the North-East level and by 11% at the national level during the last 10 years with a total average production of 82 million liters (OEP, 2015). The study was carried out in 10 different zones of the Governorate, where dairy farming is the predominant activity on small farms (M’Hamdi et al., 2009; M’Hamdi et al., 2017). The study involved 107 dairy cattle farms. Over 90% of selected farms were small-sized with an average herd size of 6.4 ± 3.8 cows and an average acreage of 10.4 ± 15.9 ha. The selection criteria were based on the dairy vocation of the farm, the availability, and collaboration of farmers. The sample size was selected based on the equation reported by Cochran (1977) under a 95% confidence interval and precision of 10%.
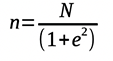
5where n is the sample size, N is the population size, and e is the level of precision.
2.2. Survey and data collection
6A survey including 122 questions was developed to collect the needed information to assess sustainability. Data collection was performed during interviews with individual farmers that lasted for about 4 h. At first, an exploratory study was conducted to make initial contact and provide an overview of the study to farmers in the study area. It also aims to collect the basic data needed to plan the final sample size. It started by pre-testing the questionnaire to test the relevance of the content. After that, we carried out a complete data collection, covering the topics of livestock management and performance, fodder availability, farm characteristics, biodiversity aspects, land management and agricultural practices, socio-economic condition of the farmers, and indicators used for sustainability analysis. The data collected was analyzed to allow the calculation of sustainability indicators, components, and scales on the IDEA method calculator (Zahm et al., 2019).
2.3. Presentation of IDEA, justification of the use of the method, and its adaptation
7The IDEA method (Indicateurs de Durabilité des Exploitations Agricoles or Farm Sustainability Indicators) is one of the most successful methods used to assess sustainability of farms under three dimensions: agro-ecological, socio-territorial, and economic (M’Hamdi et al., 2017; Sotamenou & Pogha, 2018; Biret et al., 2019). It is a tool for establishing a multi-criteria evaluation of production systems concerning the environment, the economy, and the social pillars; and to quantify the possible improvements of the production system (Viaux, 1999; Vilain et al., 2003). It was initially designed to be applied to French case studies. However, several researchers have used it to measure the sustainability of farms in different contexts: in Algeria (Ghozlane et al., 2010; Bekhouche-Guendouz, 2011; Benatallah et al., 2013), in Tunisia (M’Hamdi et al., 2009), in Lebanon (Srour, 2006), in Brazil (De Castro et al., 2009) among others. The IDEA method comprises three sustainability scales of the same weight and varying over a range of 0 to 100 points (Vilain et al., 2003). The agro-ecological scale consists of three components (diversity of production, organization of space, and farming practices) and has 18 indicators. The socio-territorial scale consists of three components (quality of products and land, employment and services, ethics and human development) and has 18 indicators as well. The economic scale consists of four components (economic viability, independence, transferability, and efficiency) and has six indicators. These indicators represent the variables to be assessed which can be quantitative or qualitative. They can be absolute fixed values, such as thresholds, minimum or maximum acceptable values, or targets (Meul et al., 2008; Lebacq et al., 2013). This is also applied to the 11 components that have the same weight out of the total score of 100 (33 or 34 points on the two first scales and 20 or 30 points on the economic scale). The final value of sustainability is the lowest value of the three scales, thus applying the limiting factors rule in ecosystem dynamics (Zahm et al., 2008).
8The choice of the IDEA method was related to the possibilities of quantification of sustainability indicators, analyzing objectively the strengths and the weaknesses of the production system, and having indicators that characterize key concepts from the definition of sustainable agriculture. The IDEA approach will be used to examine the sustainability of these farms in their current state, and the results will represent a basis for developing improved and appropriate strategies and management approaches as related to different scales and environments (agro-ecological, socio-territorial and economic). Zahm et al. (2008) state that there is not just one farm sustainability model and, therefore, the indicators must be adapted to local farming before using the IDEA method. To adapt the IDEA approach to the local Tunisian context, we applied some changes to the original grid (Vilain et al., 2008). The changes impacted 19 indicators out of 42. These adaptations concerned the definition and the determination modalities. It consisted of modifications, acceptance, or rejection of the variables and the weighting of each one as shown on table 1.
2.4. Calculation and statistical analyses
9The indicators were expressed in different units: weight, length, area, number, farmers’ attitudes, and economic gain. The data were standardized by being transformed into a scale for each indicator using IDEA calculator (Excel). Regardless of the original units of each indicator, they were expressed at a certain value on the scale, according to the IDEA tool. The final score of each scale is the sum of its indicators. Then, statistical analyzes were performed on these quantitative data using SAS software (version 9.1.3) (means, standard deviations, minimum, maximum) (SAS, 2002) and XLSTAT (2016) for multidimensional statistical of the data allowing a more detailed interpretation of the results. To highlight the main factors of variation in the sustainability of the surveyed farms, a principal component analysis (PCA) is carried out using the three scales of sustainability. Then, the data analysis consisted of an Ascending Hierarchical Classification (AHC) to perform the grouping of surveyed farms in classes that are as homogeneous as possible, using the components as variables.
3. Results
3.1. Global sustainability and components scores
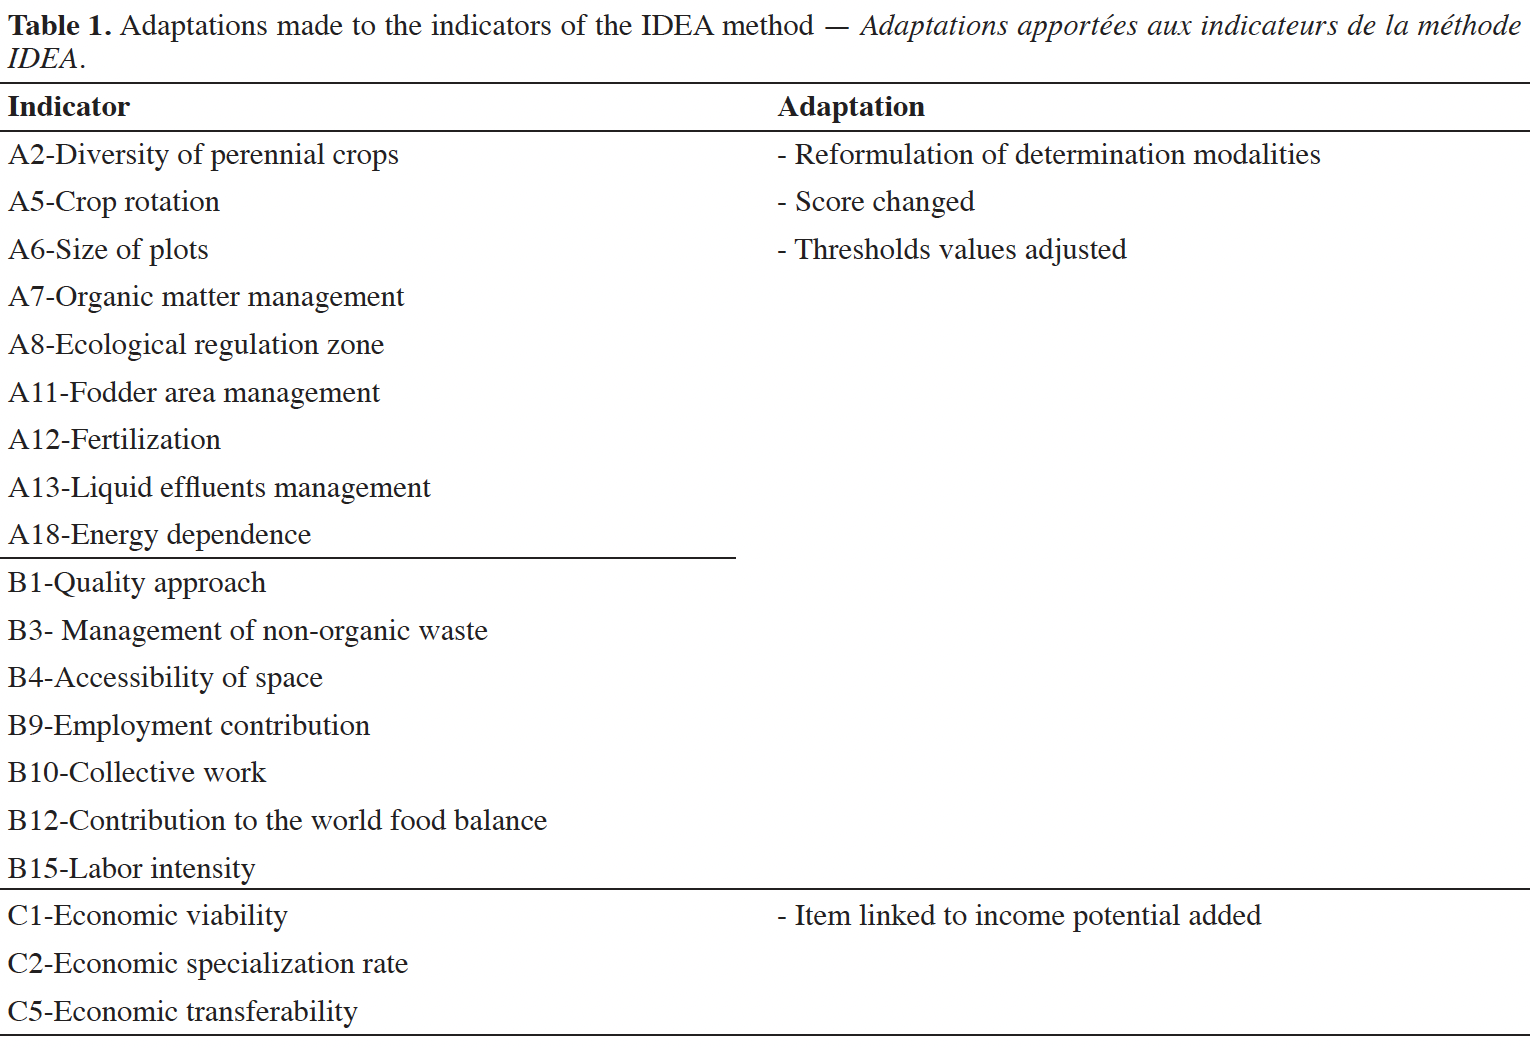
10The highest average score of sustainability of all farms was reported on the agro-ecological scale (64.76 ± 12.47) with a minimum of 41 and a maximum of 100 (Figure 1). The economic scale has a slightly lower score of 63.43 ± 10.69 with a minimum of 34 and a maximum of 88 points. The lowest score was attributed to the socio-territorial scale, which corresponds to the final score of the farm’s sustainability with a value of 55.84 ± 10.25 and ranges from 35 to 86 points.
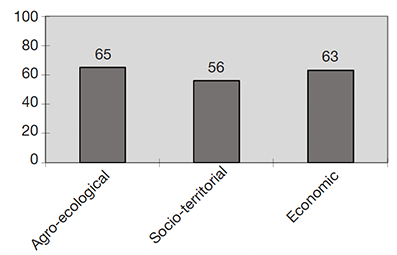
Figure 1. Global sustainability score of the farms studied —Score global de la durabilité des exploitations étudiées.
11The different sustainability components scores (Figure 2) allow us to assess sustainability as the surface area covered by the line joining component scores with the surface area covered by the outside perimeter and to identify easily strengths and weaknesses at farm levels. We note that the components “quality of products and territories”, “ethics and human development”, “viability” and “efficiency” have the lowest values, respectively 15.5; 16.8; 12.8, and 7.54. The components “diversity”, “farming practices”, “employment and services” and “independence” record the highest scores, respectively 25.4; 19.9; 23.4, and 24.9.
Figure 2. Graphical representation of the sustainability components of the farms studied — Représentation graphique des composantes de la durabilité des exploitations étudiées.
3.2. Analysis of sustainability indicators
12Agro-ecological scale. The agro-ecological components sustainability and indicators (Table 2) have the highest value among the other scales. The high performances are linked to the high scores obtained by the components: “Diversity” contributes the most at about 39%, whereas “farming practices” and “organization of space” contribute less (respectively 31 and 30%). This is confirmed by the higher scores of “animal diversity” and “annual or temporary crops” indicators. However, the “perennial crops” and “conservation of local genetic resources” indicators have the lowest values. For the “space organization” component, registered weaknesses are mainly related to “contribution to environmental issues”. Likewise, the indicators “crop rotation”, “ecological regulation zone” and “space management” register relatively low scores (41, 41, and 42% of maximum theoretical scores). In addition, the “organic matter management” indicator is highly considered by the great majority of farmers (86% of the theoretical maximum score). Indeed, all the evaluated farms use all the manure that is produced on the farm and about 85% of breeders use it on more than 20% of the agricultural area to increase soil fertility and to reduce the purchase of fertilizers. However, farming practices are penalized by the “fertilization” and “energy dependence” indicators with the lowest obtained scores (17% and 15% of the theoretical maximum scores). In the studied farms, irrigation is relatively low and most often restricted to vegetable crops and some fodder crops.
13Socio-territorial scale. The socio-territorial scale (Table 3) is the weak and limiting factor of the farms because of the very low scores obtained from some indicators. These weaknesses are due to the low score of the management of non-organic waste (21% of the theoretical maximum score). In addition, low recorded scores of the indicators “social implication” (34%) and “training” (6%) are reflecting the limited involvement of farmers in social activities. Furthermore, there are no “services and multi-activities” (1%) for the local area and the indicator “contribution to the world food balance” records a low score equivalent to 36% of the theoretical maximum score.
14Economic scale. The score of the economic sustainability scale (Table 4) is acceptable (63% of the theoretical maximum), while these results are explained by the compensation between indicators. The viability component is divided into two indicators, economic viability and economic specialization rate which obtain 7.85 and 5.01 points respectively (representing 39 and 50% of the theoretical maximum scores).
3.3. Descriptive analysis
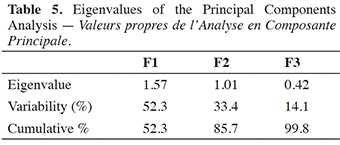
15Table 5 of eigenvalues indicates a very dominant main component (F1) which explains nearly 53% of the total variability and the three first axes explain almost 100% of the variability. In addition, the first two axes (F1 and F2) contain most of the information (an eigenvalue greater than 1 and 85% of the cumulative variability).
16We note that the agro-ecological and the socio-territorial scales are strongly represented on axis 1 by 50 and 49% respectively; while on axis 2, variables are discriminated according to the economic scale with a contribution of 98%. There is a positive correlation between the agro-ecological scale and the socio-territorial scale (r = 0.56), while the economic and socio-territorial scales are independent (Figure 3).
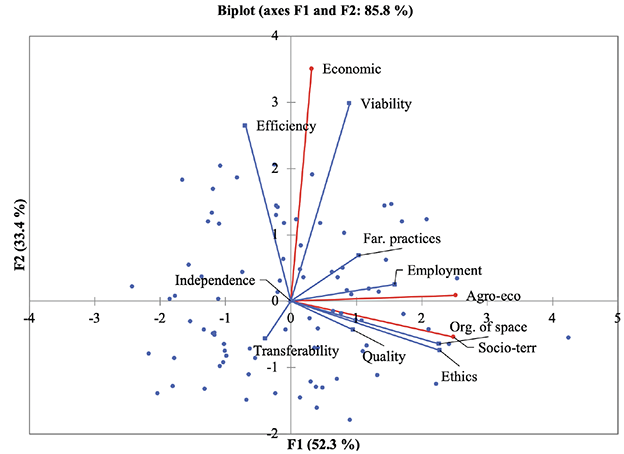
Figure 3. Graphical representation of the principal component analysis of the components and scales of sustainability of the farms studied — Représentation graphique de l’analyse en composantes principales des composantes et des échelles de durabilité des exploitations étudiées.
17According to figure 3 which illustrates correlations between the scales and the different components, the agro-ecological and socio-territorial scales are correlated positively to all the components, except the transferability and the efficiency (r = -0.13; r = -0.21 and r = -0.09; r = -0.32 respectively). The second axis presents the economic scale, which regroups the farms with the highest economic scores, linked to a low socio-territorial score, but they are positively and highly correlated to viability and efficiency components.
18The results of the Ascending Hierarchical Classification (AHC) indicate that many differences, as well as some similarities, exist when comparing farms from the four clusters (Figure 4). We undertake farm segmentation based on the 10 components of sustainability. According to the information in the clusters’ profile, we distinguish four clusters. The first group is composed of 17% of the farms. They are characterized by small agricultural lands of about 2.2 ha destined for fodder crops (97% of the area) and only 3% for vegetable crops. In addition to cattle (4.9 dairy cows), these farmers have a few sheep (2.9 head). The second is presented with 37% of exploitations. This group is defined by larger agricultural land of about 5.7 ha, more diversified crops (forages, vegetables, cereals, olive, and arboriculture of about 71.3, 16.7, 10.8, 1.5, and 0.1% respectively), and a varied livestock also (4.8 dairy cows, 14.2 head of sheep and 1.5 head of goats). The third cluster includes 20% of farmers. The average agricultural area is 3.6 ha, mainly used for fodder crops (68%), followed by vegetables (29%), and 2% is reserved for olive cultivation. Livestock farming is also diversified for this group. Farmers have an average of 7.8 head of present dairy cows and 3.1 head of sheep. The last group includes 26% of the most diversified farms. These exploitations are the largest with an average area of 19.5 ha, 61% of which are devoted to fodder crops, 20% to cereals, 13.5% to vegetables, 3.5% to olive cultivation, and 2% to arboriculture. Furthermore, these farmers have the largest herds with an average of 7.8, 31.9, and 1.8 head of dairy cows, sheep, and goats respectively.
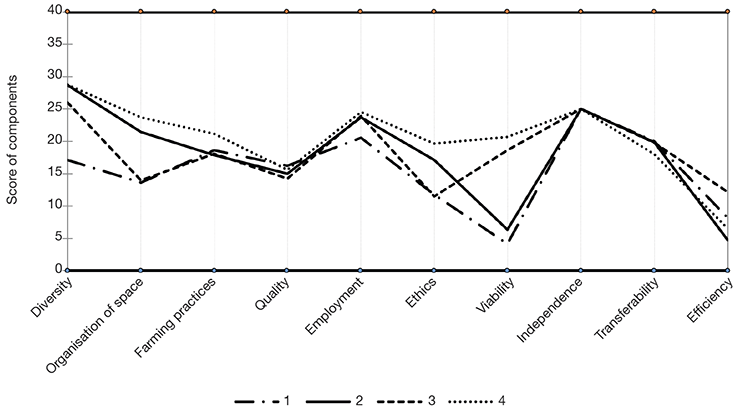
Figure 4. Profile of clusters identified by AHC (1: cluster1; 2: cluster2; 3: cluster3 and 4: cluster4) — Profile des groupes identifiés par la CAH (1: Groupe 1; 2: Groupe 2; 3: Groupe 3 et 4: Groupe 4).
19Regarding the similarities, all the groups achieve the highest level of economic independence (100%) and a high level of transferability (an average of 97%). This independence is reflecting important financial dependence and zero sensitivity to support. It can be concluded that the current forms and the selection criteria to benefit from public assistance and subsidies are far from being applied to these farmers. However, they resort to other ways to achieve the called “financial independence”. Also, we note a very small variation between clusters for the component quality of products and territories. Consequently, the groups’ characterization is based on the variations and differentiations regarding the components. The first cluster represents the least sustainable farms for all components with many registered weaknesses for all the scales (agro-ecological: 49, socio-territorial: 49, and economic: 57). The second group of farms presents acceptable scores for sustainability related to the agro-ecological and socio-territorial scales (68, 56 respectively) but very low economic sustainability (56) compared to the mean score. The third class concerns farms with the best economic sustainability (76), but with low agro-ecological and socio-territorial sustainability (58 and 50). The fourth group is associated with the most sustainable farms on the three scales. They record the highest agro-ecological and socio-territorial scores and an acceptable economic one (74, 60, and 70).
4. Discussion
4.1. Global sustainability and components scores
20The global sustainability score corresponds to the socio-territorial scale. Thereby, farmers should focus their efforts on this dimension that characterizes the integration of the farm within its landscape and in society and is used to assess the quality of life of the farmer by measuring human development, citizenship, ethics, coherence, and local development. The obtained low values may be related to the absence of “quality and territories” management with a score of 47% of the maximum theoretical score. In the Tunisian context, it seems that the efficiency component of the productive process maintains the lowest value. Therefore, the farms with high agro-ecological scores are characterized by a large diversity of animals and cultures and an excellent organization of the space. These farmers seem interested in ethics and human development, but they focus less on farming practices and employment. Similarly, the farms with high socio-territorial scores follow the same variation with different levels; thereby, additional interest is intended for ethics and employment. The organization of space contributes also to the evolution of their socio-territorial sustainability. In addition, the high positive correlation between the quality of products and territories is characterizing these farms (M’Hamdi et al., 2009; Benidir et al., 2013; Bir et al., 2019). Indeed, the high dependence on external inputs drastically reduces economic efficiency (Van Passel et al., 2007). In contrast, when the dependence on external inputs is lower the farms take advantage of their available resources, then the production efficiency increases.
4.2. Analysis of sustainability indicators
21Agro-ecological scale. The high score of the diversity’ component is explained by the presence of many species. At least three species with four breeds per farm (sheep, goat, fattening bovine), in addition to dairy cattle and different annual crop species and varieties (barley, oats, alfalfa, ryegrass, berseem, corn, sorghum) are present at the farm. However, the absence of meadows and the small areas intended for arboriculture and other perennial woody plants could explain this low value of “perennial crops” and “conservation of local genetic resources”. For the “space organization” component, registered weaknesses are mainly related to contribution to environmental issues. Nevertheless, the strength of the “organization of space” component is represented in the “fodder area management”. This indicator has an acceptable average score (1.72 points). In addition, the farmers are trying to adapt their farming practices to ameliorate the conduct of their exploitations. Indeed, all the produced manure is used at the farms and about 85% of breeders use it on more than 20% of the agricultural area to increase soil fertility and to reduce the purchase of fertilizers. However, they still use excessive and uncontrolled quantities of fertilizers, even when they use manure. Also, they are not controlling the electricity and fuel use which decreases the score of the “energy dependence” indicator. In the studied farms, irrigation is relatively low and most often restricted to vegetable crops and some fodder crops.
22Despite some weaknesses characterizing the small farms of this region, the indicators led to high performances on the agro-ecological scale. According to Zahm et al. (2008), this scale analyses the propensity of the technical system to make efficient use of the environment at the lowest possible ecological cost via different indicators from three components of equal importance. However, some improvements such as reduction of the use of fertilizers and energy dependence should be taken.
23Socio-territorial scale. The poor performance of socio-territorial indicators is mostly due to the low score of the “management of non-organic waste”. It is explained by the burning of bottles of pesticides, fertilizer and concentrate bags and other wastes practiced by many farmers causing the emission of toxic gases. Also, the low scores of the indicators “social implication” and “training” are consequences of the limited involvement of farmers in social activities, such as the participation in social events and associative structures, the absence of training programs adapted to the educational levels of farmers and the limited accessibility to information. In addition, there are no services and multi-activities for the local area that refer mainly to agro-tourism, pedagogical farms, or involvement in scientific research. Furthermore, the indicator “contribution to the world food balance” records a low score that reflects an excessive use of concentrate feed due to the intensification of livestock systems. This low score is also explained by the absence of “services and multi-activities” (1% of the maximum theoretical score) in the rural regions that could improve the quality of farmers’ lives. In addition, among the most serious other handicaps, 59.6% of farms are difficult to be reached, 28.4% moderately accessible and only 11.9% of farms are easily accessible. We can also associate the low educational level of farmers since only 5.5% of them have an university degree and 22.9% have completed secondary school, while 56.9% of them had followed just primary education and 14.7% are illiterate.
24These high values refer to the goodwill of many farmers to continue working in agriculture, and an attachment character of the local populations to the heritage of ancestors. There is a large network of seasonal workers in rural areas that influence several indicators and increase their values (collective work, reception hygiene, and safety). However, these workers suffer from many problems although there is a high quality of human relations and strong social links with relatives and the neighborhood (“isolation” and “quality of life”; 66% and 59% respectively). Though, there is a necessary need for an improvement that must be made at the level of all the indicators of the socio-territorial scale.
25Economic scale. Economic sustainability reaches an acceptable value which is characterized by an amplitude of scores on its various indicators that is relatively high. However, the economic viability indicator obtained variable results reflecting the heterogeneity of the situations. This reveals the serious economic problems of most farmers that present levels of income lower than the SMIG (the guaranteed inter-professional minimum wage). The economic specialization rate evaluates the economic contribution of the principal activity of the farm and buyer diversification. These farms have the advantage of having a moderate level of specialization which allows farmers to adjust to economic constraints. Bir et al. (2019) explain that these constraints can be linked especially to market fluctuations. The independence component provides information on financial autonomy and sensitivity to subsidies and aid. Therefore, these indicators are at their maximum value. This can be explained by the absence of recourse to credit to finance investments. Thus, it can be concluded that all these farms depend on their financial potential. According to Zahm et al. (2008), transferability analyses the long-term ability to carry on from one generation to the next. In cases of succession, the amount of capital required to run and take over can end up leading to the farm being broken up. In our study, this indicator recorded a high score of 90% of the theoretical maximum score, contrary to Bir et al. (2019) who report 54% notifying that the importance of capital harms the transferability of the farms. However, efficiency is the lowest indicator of the economic scale. This reflects a high degree of dependence on external inputs. Our results are similar to those of Benidir et al. (2013) and Bir et al. (2019), about 7.98 and 7.71 respectively. The importance of inputs and the rise in the prices of concentrates, fertilizers, phytosanitary products, and energy results in low efficiency of the productive process, which automatically affects economic viability (Bir et al., 2019).
5. Conclusions
26Despite some limitations of the study, the sustainability assessment grid designed for the North region of Tunisia provides a globally representative image of the sustainability of small Tunisian farms. Thus, the IDEA method makes it possible to sensitize farmers to the notion of sustainability and the need to take better account by improving their agricultural practices, improving their social and territorial relations, and giving more interest to the economic dimension. Indeed, the weaknesses registered in each scale and detailed according to the different indicators can lead decision-makers to design an oriented strategic plan to ensure more sustainable production systems. This analysis could be valued in a process of promotion of sustainable agriculture. Thereby, research institutes, development, and agricultural education could thus broaden their approach and their technical or educational orientations by relying on these multiple systems which combine ecologically sound production with economic viability.
Bibliographie
Alary V. et al., 2020. Multi-criteria assessment of the sustainability of farming systems in the reclaimed desert lands of Egypt. Agric. Syst., 183, 102863, doi.org/10.1016/j.agsy.2020.102863
Amsidder L., Alary V. & Sraïri T.M., 2021. An empirical approach of past and present mobility management in the desert societies of camel breeders in South Eastern Morocco. J. Arid Environ., 189, doi.org/10.1016/j.jaridenv.2021.104501
Attia K. et al., 2021. Sustainability assessment of small dairy farms from the main cattle farming systems in the North of Tunisia. New Medit, 20(3), 191-205, doi.org/10.30682/nm2103m
Bekhouche-Guendouz N., 2011. Évaluation de la durabilité des exploitations bovines laitières des Bassins de la Mitidja et d'Annaba. Thèse de doctorat : Institut National Polytechnique de Lorraine (France).
Benatallah A., Yakhlef H., Ghozlane F. & Marie M., 2013. Évaluation de la durabilité des exploitations bovines laitières de la zone de Birtouta, Mitidja (Algérie) à l’aide de la méthode IDEA. Renc. Rech. Ruminants, 20, 242.
Benidir M., Ghozlane F., Bousbia A. & Belkheir B., 2013. The use of a critical analysis of a multi-criterion method (IDEA) for assessing the sustainability of sedentary sheep rearing systems in the Algerian steppe areas. Afr. J. Agric. Res., 8(9), 804-811, doi.org/10.5897/AJAR12.1006
Bir A., Benidir M. & Ikhlef S., 2019. Sustainability analysis of dairy cattle farms and their susceptibility to climatic hazards in the semi-arid area of Setif (Algeria). Bulg. J. Agric. Sci., 25(1), 3-9.
Biret C. et al., 2019. Assessing sustainability of different forms of farm organization: adaptation of IDEA method to rubber family farms in Thailand. Biotechnol. Agron. Soc. Environ., 23(2), 74 -87, doi.org/10.25518/1780-4507.17622
Bosc PM. et al., 2015. Defining, Characterizing, and Measuring Family Farming Models. In: Sourisseau J.M., ed. Family farming and the worlds to come. Dordrecht, The Netherlands: Springer, 37-55, doi.org/10.1007/978-94-017-9358-2_3
Cochran W.G., 1977. Sampling techniques. New York, NY, USA: Wiley & Sons.
De Castro J. et al., 2009. Adaptation de la méthode française IDEA pour l’évaluation de la durabilité des exploitations agricoles de la commune de São Pedro (État de São Paulo, Brésil). Renc. Rech. Ruminants, 16(1), 101-104.
Flori L. et al., 2019. A genomic map of climate adaptation in Mediterranean cattle breeds. Mol. Ecol., 28(5), 1009-1029, doi.org/10.1111/mec.15004
Ghozlane F., Bousbia A. & Yakhlef H., 2010. Évaluation de la durabilité des systèmes d’élevage bovin locaux dans la région d’El-Tarf (Algérie). Renc. Rech. Ruminants, 17, 263.
Graeub B.E. et al., 2016. The state of family farms in the world. World Dev., 87, 1-15, doi.org/10.1016/j.worlddev.2015.05.012
Hoffmann I., 2013. Adaptation to climate change – exploring the potential of locally adapted breeds. Animal, 7(s2), 346-362, doi.org/10.1017/S1751731113000815
IGRMM (Interprofessional Group of Red Meats and Milk), 2015. Annual activity report. Tunis : IGRMM.
Lebacq T., Baret P.V. & Stilmant D., 2013. Sustainability indicators for livestock farming. A review. Agron. Sustain. Dev., 33(2), 311-327, doi.org/10.1007/s13593-012-0121-x
Lusson J.-M. & Coquil X., 2016. Transitions vers des systèmes autonomes et économes en intrants avec élevages de bovins : freins, motivations, apprentissages. Innovations Agron., 49, 353-364, doi.org/10.15454/1.4622868226062979E12
Márquez Romero F. et al., 2016. Sustentabilidad ambiental en fincas cafetaleras despues de un proceso de certificación orgánica en la convencion (Cusco, Perú). Ecol. Apl., 15(2), 125-132, doi.org/10.21704/rea.v15i2.752
Meul M. et al., 2008. MOTIFS: a monitoring tool for integrated farm sustainability. Agron. Sustainable Dev., 28(2), 321-332, doi.org/10.1051/agro:2008001
M’Hamdi N., Aloulou R., Hedhly M. & Ben Hamouda M., 2009. Évaluation de la durabilité des exploitations laitières tunisiennes par la méthode IDEA. Biotechnol. Agron. Soc. Environ., 13(2), 221-228.
M’Hamdi N. et al., 2017. Assessment of sustainability of smallholder beef cattle farms in the north of Tunisia. J. Anim. Res. Nutr., 2(1), doi.org/10.21767/2572-5459.100023
Nardone A., Zervas G. & Ronchi B., 2004. Sustainability of small ruminant organic systems of production. Livest. Prod. Sci., 90(1), 27-39, doi.org/10.1016/j.livprodsci.2004.07.004
Nori M., Ragkos A. & Farinella D., 2017. Agro-pastoralism as an asset for sustainable Mediterranean Islands. In: Proceedings of the Mediterranean Islands Conference, Imagining the Mediterranean: challenges and perspectives, September 21th-24th, 2016, Island of Vis, Croatia, 135-147.
OEP (Office of Livestock and Pasture), 2015. Annual activity report. Tunis: OEP.
Otta S. et al., 2016. Evaluación de sustentabilidad de un modelo extensivo de cría bovina en Mendoza, Argentina. Rev. Fac. Cienc. Agrar, Univ. Nac. Cuyo, 48(1), 179-195.
Paracchini M.L. et al., 2015. A diagnostic system to assess sustainability at a farm level: the SOSTARE model. Agric. Syst., 133, 35-53, doi.org/10.1016/j.agsy.2014.10.004
Peña J., Alegre J. & Bardales R., 2018. Effects of cultivated richness on the sustainability of agroforestry systems in the south Peruvian Amazon. Ecosistemas, 27(3), 87-95, doi.org/10.7818/ECOS.1522
Sarandón S.J., 2002. El desarrollo y uso de indicadores para evaluar la sustentabilidad de los agroecosistemas. In: Sarandón S., ed. Agroecología: el camino para una agricultura sustentable. La Plata, Argentina: Ediciones Científicas Americanas, 393-414.
SAS (Statistical Analysis Systems), 2002. User’s guide. Cary, USA: SAS Institute.
Sotamenou J. & Soh Fogwa Pogha A.-C., 2018. Évaluation de la durabilité de l’agropole d’ananas de Nlohe (Cameroun) par la méthode IDEA. Syst. Alimentaires Food Syst., 3, 219-241.
Srour G., 2006. Amélioration durable de l’élevage des petits ruminants au Liban. Thèse de doctorat : Institut National Polytechnique de Lorraine (France).
Thiollet-Scholtus M. & Bockstaller C., 2015. Using indicators to assess the environmental impacts of wine-growing activity: the INDIGO® method. Eur. J. Agron., 62, 13-25, doi.org/10.1016/j.eja.2014.09.001
Tilman D. et al., 2002. Agricultural sustainability and intensive production practices. Nature, 418(6898), 671-677, doi.org/10.1038/nature01014
Van Der Ploeg J.D. et al., 2019. The economic potential of agroecology: empirical evidence from Europe. J. Rural Stud., 71, 46-61, doi.org/10.1016/j.jrurstud.2019.09.003
Van Passel S., Nevens F., Mathijs E. & Van Huylenbroeck G., 2007. Measuring farm sustainability and explaining differences in sustainable efficiency. Ecol. Econ., 62(1), 149-161, doi.org/10.1016/j.ecolecon.2006.06.008
Van Passel S. & Meul M., 2012. Multilevel and multi-user sustainability assessment of farming systems. Environ. Impact Assess. Rev., 32(1), 170-180, doi.org/10.1016/j.eiar.2011.08.005
Viaux P., 1999. Une troisième voie en grande culture – environnement, qualité, rentabilité. Paris : France Agricole, 211.
Vilain L. et al., 2003. La méthode IDEA, guide d’utilisation. 2e éd. Dijon, France : Éducagri Éditions, 149.
Vilain L. et al., 2008. La méthode IDEA : indicateurs de durabilité des exploitations agricoles. Guide d’utilisation. 3e éd. Dijon, France : Éducagri Éditions.
XLSTAT, Version 2016.02.27444.
Zahm F. et al., 2008. Assessing farm sustainability with the IDEA method - from the concept of agriculture sustainability to case studies on farms. Sustainable Dev., 16(4), 271-281, doi:10.1002/sd.380
Zahm F. et al., 2019. Évaluer la durabilité des exploitations agricoles. La méthode IDEA v4, un cadre conceptuel mobilisant dimensions et propriétés de la durabilité. Cah. Agric., 28, 5.