


- Accueil
- Volume 27 (2024)
- number 1-2
- Contribution of 3D automated mineralogy in unraveling the formation history of Nb-Ta-Sn mineralized LCT pegmatites in the Karagwe-Ankole belt (Central Africa)


Visualisation(s): 900 (21 ULiège)
Téléchargement(s): 441 (18 ULiège)

Contribution of 3D automated mineralogy in unraveling the formation history of Nb-Ta-Sn mineralized LCT pegmatites in the Karagwe-Ankole belt (Central Africa)

Abstract
The Mesoproterozoic Karagwe-Ankole belt (KAB) in Central Africa hosts important mineralized lithium-cesium-tantalum pegmatites enriched in Sn, Nb, Ta and W. Microscopic techniques are required to further refine the paragenetic history of mineralized pegmatites in the KAB and to understand the pegmatite-forming processes leading to an enrichment of economically important minerals. Using a combination of scanning electron microscopy (SEM)-based automated mineralogy systems with X-ray computed tomography (µCT), we investigated the mineral relationships in a three-dimensional (3D) space. This paper presents new insights into the crystallization sequence of mineralized pegmatites in the KAB. A stage of albitization followed the primary crystallization, where muscovite probably plays a role in the fluid migration and the subsequent precipitation of ore minerals. Primary saccharoidal albitization was followed by tourmaline crystallization, but before the secondary cleavelandite-type albitization. The ‘Cornish Type’ cassiterite originating from greisen pockets confirms the suggested hydrothermal formation conditions. A first-time description of oriented zircon and the association with flat tabular columbite-tantalite points to the importance of local magmatic-hydrothermal conditions. This study emphasizes the possibilities of using 3D automated mineralogy for the identification of minerals and their position in the paragenetic history of mineralized pegmatites and by extension of microscopically complex and diverse ore deposits.
Table des matières
1. Introduction
1The Mesoproterozoic Karagwe-Ankole belt (KAB) in Central Africa is well known for the occurrence of pegmatites that host important Sn, Nb, Ta and W mineralization and which contain other economically interesting metals, including Li, Be, U and Th (Dewaele et al., 2011; Hulsbosch et al., 2013, 2014; Pohl et al., 2013; Melcher et al., 2015). Pegmatites are essentially plutonic igneous rocks, typically of granitic composition, which are distinguished from the more common plutonic igneous rocks by their texturally and mineralogically diverse internal fabrics (London, 2018). Two endmember models are proposed for pegmatite formation: the differentiation model considers pegmatite formation through extreme magmatic differentiation of a granitic source melt (Černý, 1991; London, 2018), whereas the anatectic model considers pegmatite formation through low-degree partial melting of metamorphic source rock (Černý, 1991; Simmons & Webber, 2008). The pegmatites of the KAB region are considered to be a classic example of the differentiation model, as they are spatially and genetically related to granitic intrusions and show a typical concentric zonation with increasing distance from the granite (Varlamoff, 1972; Hulsbosch et al., 2013, 2014; Turimumahoro et al., 2020).
2Pegmatites formed by the differentiation model commonly form segregations along the upper margin of the source pluton and follow an increasing chemical fractionation with distance from the source (Černý, 1991; Hulsbosch et al., 2014). The evolved granitic melts often contain an unusually high concentration of fluxing compounds (e.g., F, B, Li and P) which play a key role in the enrichment of incompatible elements during the primary magmatic crystallization. However, these pegmatites may be overprinted by posterior magmatic-hydrothermal fluids (Linnen et al., 2012). The role of these fluids involved in the magmatic-hydrothermal transition and afterward is yet not well understood (Kaeter et al., 2018). Due to the extended evolution and later overprint of the pegmatites, they may contain a well-recognized diversity and elevated concentrations of incompatible, and economically important, elements (e.g., Be, F, Li, Nb, Ta and W) and can be considered as sources of strategic metals (Linnen et al., 2012). Green technologies require sustainable mineral sourcing of many of these strategic elements to deliver decarbonization solutions for both the environment and society (Ali et al., 2017; Herrington, 2021) and therefore require a full mineralogical and textural characterization (Lobos et al., 2016).
3Many studies are available on the petrography and mineralogy of pegmatites (Dill, 2015), but the common textural complexity (e.g., differentiation between primary and secondary micas) (Van Lichtervelde et al., 2008) and their coarse granulometry often impede the differentiation of subsequent crystallization stages in the paragenesis of the pegmatites. In addition, minerals containing economically interesting elements are only present as ‘nuggets’ dispersed throughout the different zones in the pegmatites. The internal fabric of pegmatites, often zoned, is manifested in spatial variations of grain size, mineral assemblages, crystal habit and rock fabric (London, 2008). This internal mineralogical zonation of individual pegmatite dykes is often complicated and obscured by a high degree of post-magmatic alteration and weathering (Dewaele et al., 2016). Rock textures are a response to geological processes, and are, therefore, an important feature in the study of ore formation models (Lobos et al., 2016). The documentation of the texture and distribution of chemical elements in pegmatite-forming minerals is necessary to establish the ground truth for petrological models (Lindgren, 1937; Cameron et al., 1949; Jahns, 1953; Vlasov, 1961) and for verification of experimental simulations of pegmatite-forming processes (Jahns & Burnham, 1969; London & Morgan, 2017).
4To establish the paragenetic history of pegmatites and to obtain a detailed mineralogical and textural characterization, mostly two-dimensional (2D) petrographic observations of the crystal morphology, mutual grain boundaries and assumed mineral inclusions in polished sections are examined. This information should be interpreted with care as a 2D view of a three-dimensional (3D) material may influence the perception of reality in terms of mineral occurrences, orientation and interrelationships (Craig & Vaughan, 1994). Stereological methods have been developed to successfully resolve errors from 2D observations of 3D objects (Sahagian & Proussevitch, 1998). X-ray micro-computed tomography (µCT) is a non-destructive X-ray imaging technique that offers the possibility to study these mineral relationships and orientation in 3D (Cnudde & Boone, 2013; Godel, 2013; Withers et al., 2021). The principle of µCT allows to record the reconstructed attenuation coefficient µrec for each voxel of a scanned geological sample. The value of µrec depends on the material density ρ and is proportional to the effective atomic Zeff number of the material (i.e., ~Zeff3 in the typically used X-ray energy range) (Cnudde & Boone, 2013). The relative difference between µrec values of minerals provides a possibility to differentiate between minerals in 3D (Bam et al., 2020; Buyse et al., 2023). Together with mathematical methods developed to quantify structural (characteristics like size, shape and orientation of mineral grains) and stationary rock textures (patterns formed by the spatial association of minerals) (Lobos et al., 2016) and to extract low-dimensional discriminative features on mineralogy in 3D (Jardine et al., 2018; Guntoro et al., 2020), the application potential of mineral feature extraction using µCT is still expanding (Kyle & Ketcham, 2015; Guntoro et al., 2020). However, µCT is limited concerning direct information on chemical element distribution. These missing data can be partially obtained by correlative microscopy using complementary techniques such as scanning electron microscopy (SEM)-based automated mineralogy (AM) systems (Reyes et al., 2017; Warlo et al., 2021; Lubbers et al., 2023), X-ray fluorescence (Boone et al., 2011) or others (Pankhurst et al., 2019). This direct chemical information can then be correlated with the textural elements as observed in 3D (Withers et al., 2021).
5This study aims to increase our knowledge about the formation history of Nb-Sn-Ta mineralized lithium-cesium-tantalum (LCT) family pegmatites in the KAB by applying a comprehensive and innovative 3D methodology, by means of state-of-the-art µCT, on a selection of key samples from the Gatumba area (Lehmann et al., 2008; Dewaele et al., 2011; Hulsbosch et al., 2013; Lehmann et al., 2014; Melcher et al., 2015; Hulsbosch & Muchez, 2020) and from Kobokobo (Safiannikoff & Van Wambeke, 1967). The pegmatite deposits in the Gatumba area (Rwanda) and Kobokobo (Democratic Republic of Congo) can be considered representative cases of mineralized LCT pegmatites worldwide. This 3D information will contribute to the general discussion of the crystallization sequence of mineralized pegmatites. Based on information obtained from previous studies and newly executed mineralogical and geochemical 2D studies using SEM-based AM systems, the structural, mineralogical and chemical characterization of mineralized samples is extended to 3D.
2. Geological setting of the Nb-Sn-Ta pegmatites in the KAB
6The Mesoproterozoic KAB comprises a large metallogenic province that extends from the eastern part of the Democratic Republic of the Congo (DR Congo) over Tanzania, Burundi and Rwanda to the southern border of Uganda (Pohl et al., 2013). It forms, together with the Kibara belt (KIB), a NE trending Mesoproterozoic orogenic belt that developed separately within the proto-Congo Craton (Fig. 1; Tack et al., 2010; Fernandez-Alonso et al., 2012). The sedimentary sequences of the KAB document a long-lived intracratonic shallow basin history with periods of deposition, erosion and magmatism (Fernandez-Alonso et al., 2012; Debruyne et al., 2015). Bimodal magmatism at c. 1375 Ma gave rise to the Kabanga-Musongati alignment of (ultra)mafic intrusive rocks enriched in Ni-(Cu-Co-Pt), and numerous voluminous S-type granite intrusions (the so-called G1-3 granites; Tack et al., 2010) with subordinate mafic intrusive rocks (Tack et al., 2010; Pohl et al., 2013). To a smaller extent, magmatic events occurred at 1205 ± 19 Ma (A-type granite; Tack et al., 2010) and 986 ± 10 Ma (so-called G4 or S-type tin-granite; Tack et al., 2010). The numerous early Neoproterozoic Nb-Sn-Ta-W-Li mineralized pegmatites and quartz vein systems (Lehmann et al., 2014) are genetically linked with this youngest granite generation emplaced at 986 ± 10 Ma (U-Pb zircon measurements on samples from the DR Congo and Rwanda; Tack et al., 2010; De Clercq et al., 2021). Magmatic-hydrothermal quartz veins are enriched in either Sn or W with traces of gold. Neoproterozoic alkaline and carbonatitic magmatism that occurred between 830 and 650 Ma and formed aligned with the present-day Western Rift, is linked with rare earth element mineralization (Maravic et al., 1989; Buyse et al., 2020).
7In recent years, many studies focused on Nb-Sn-Ta pegmatite-related mineralization in the Gatumba area in western Rwanda in the KAB (Lehmann et al., 2008; Dewaele et al., 2011; Hulsbosch et al., 2013; Lehmann et al., 2014; Melcher et al., 2015; Hulsbosch & Muchez, 2020; Fig. 1), which can be considered as a type case example for this type of mineralization. This pegmatite-rich area (Hulsbosch et al., 2014) comprises fresh exposures of hard-rock pegmatites (Dewaele et al., 2011) with distinct stages of Nb-Sn-Ta mineralization in the most evolved pegmatite bodies. The mineralized pegmatites belong to the LCT family and more specifically to the rare-element class, as they are known to be emplaced at intermediate shallow depth and may accumulate economic concentrations of lithophile rare elements (Černý & Ercit, 2005; Dewaele et al., 2011). In the area, Sn and W mineralized quartz veins have been identified and are considered, at least partly, to be originating from the same magmatic system (Dewaele et al., 2016; Hulsbosch, 2019). Recent geological information from other Nb-Ta-Sn mineralization in the KAB and KIB are limited available (Lehmann et al., 2014) and rather relies on samples and geological research reported in historical studies. One of these other occurrences is the Kobokobo pegmatite (Fig. 1) in South Kivu (Democratic Republic of the Congo), which has historically produced important amounts of beryl, columbite and cassiterite (Safiannikoff & Van Wambeke, 1967) and can also be classified as a rare-element class beryl type belonging to the LCT family according to the classification of Černý & Ercit (2005).
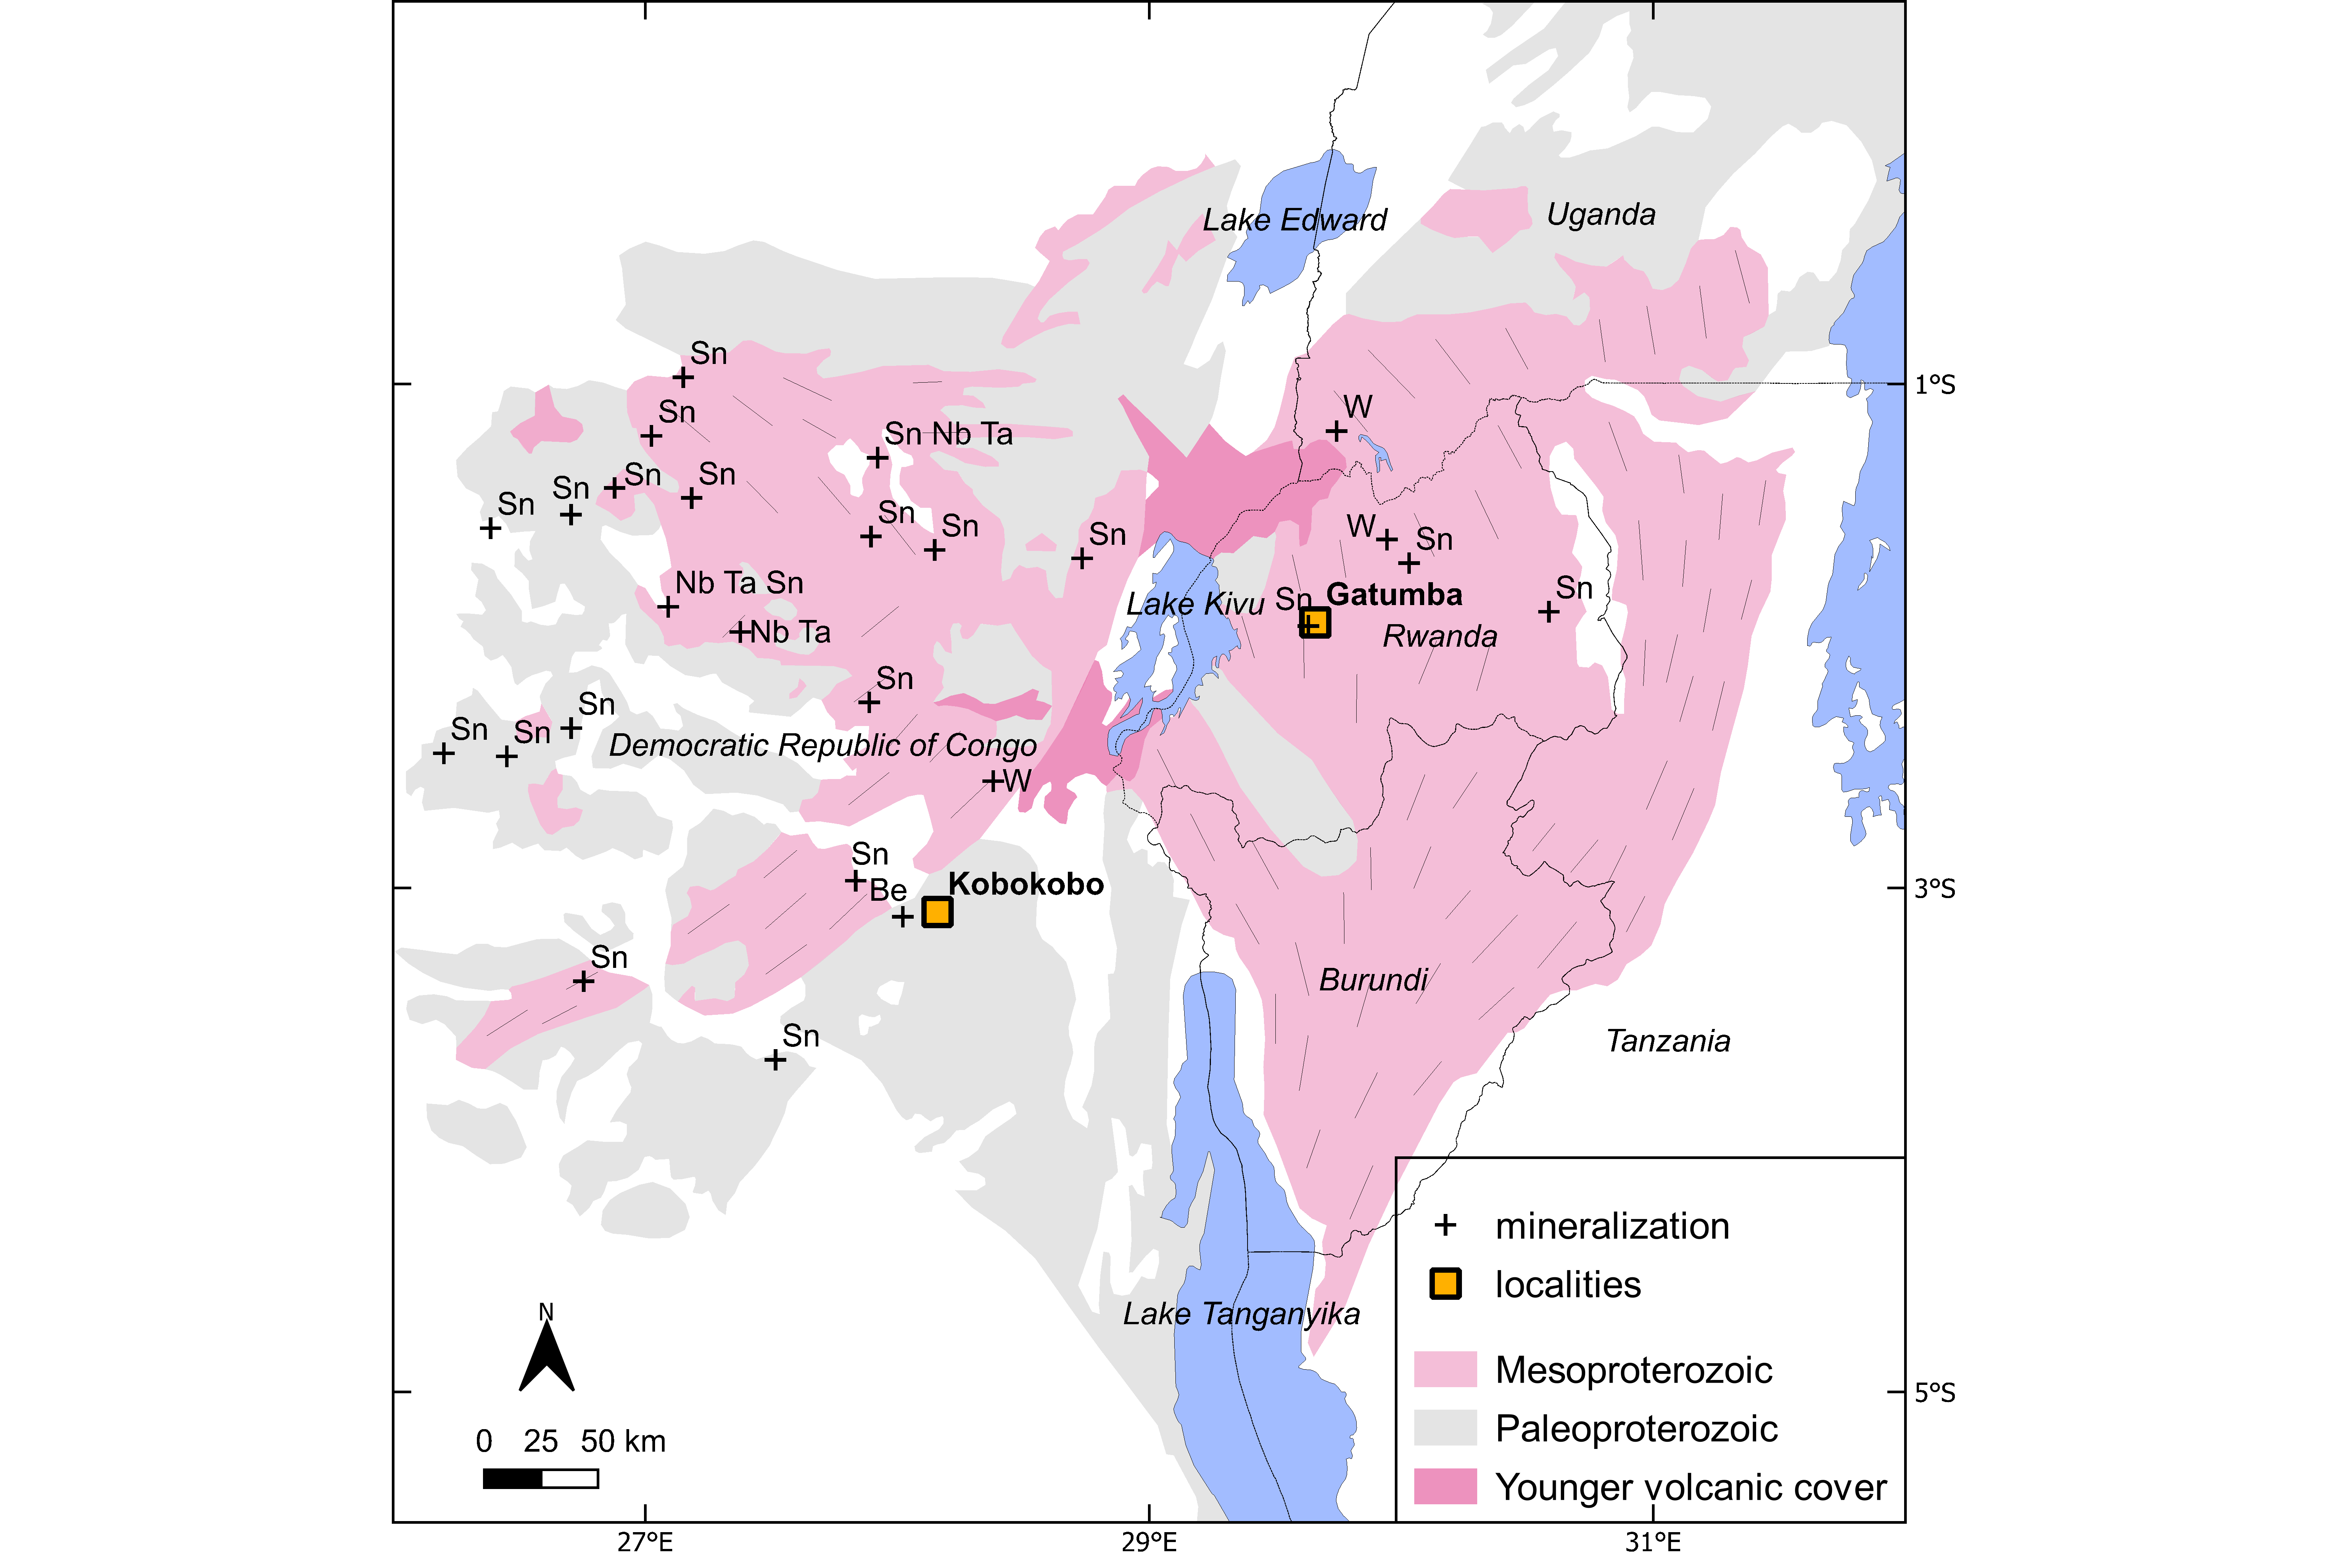
Figure 1. Regional setting of the Mesoproterozoic orogenic belts and associated Nb-Ta-Sn mineralization in the Great Lakes region of Central Africa (after Baudin et al., 1982).
3. Characteristics of the pegmatite dyke systems
8The Gatumba pegmatite system in western Rwanda (Fig. 1) is emplaced in Mesoproterozoic low- to medium-grade metasedimentary clastic rocks (metapelites and quartzites) and metamagmatic rocks (metagabbros and metadolerites) (Dewaele et al., 2011; Lehmann et al., 2014). The latter is interpreted to belong to the 1375 Ma bimodal magmatic suite (Tack et al., 2010). The metamagmatic intrusions are folded together with the metasedimentary rocks (Dewaele et al., 2011) and are preferentially crosscut by pegmatite dykes occurring along the foliation planes (Dewaele et al., 2011; Hulsbosch & Muchez, 2020). Their structural emplacement along these planes coincides with the main regional tectonic foliation Sfl (Van Daele et al., 2021) that resulted from a far-field compressional event at ~1.0 Ga (Fernandez-Alonso et al., 2012; Debruyne et al., 2015). These intrusions have only slightly been affected by late Neoproterozoic deformation that only induced local crenulation foliation Sf2 (Van Daele et al., 2021).
9The pegmatite dyke system in the Gatumba area shows a well-developed regional zonation sequence. It can be subdivided into four successive zones (biotite, two-mica, muscovite and mineralized) that follow a single path of fractional crystallization of a granitic parental melt (Varlamoff, 1975) with a systematic enrichment of Li, Rb Cs (Hulsbosch et al., 2014) in the most evolved, farthest situated mineralized pegmatites. The most differentiated mineralized LCT pegmatites from the Gatumba area display a well-developed internal mineralogical zonation for individual pegmatite dykes which can be subdivided into five zones from margin to center: border, wall, intermediate zone, quartz core and replacement zones (Hulsbosch & Muchez, 2020, fig. 3). The later metasomatic/hydrothermal overprint in the replacement zones may completely alter the original primary magmatic pegmatite composition at some locations (Dewaele et al., 2011).
10Multiphase cassiterite precipitation originates from a water-saturated melt system and is reported in three distinct stages: in magmatic microcline-quartz units of the wall zone (Cst1), in an assemblage with coarse quartz in the quartz core zone (Cst2) and in metasomatic, replacive greisen pockets (‘poches de greisen’) in the intermediate and wall zone (Cst3) (Hulsbosch & Muchez, 2020). Mineralization of Nb-Ta, mostly found as columbite-tantalite, is more equally distributed throughout the mineralized pegmatites (Dewaele et al., 2011) and is only contemporaneous with the primary magmatic pegmatite formation. Various other Nb-Ta-bearing minerals were also reported (in decreasing order of occurrence): microlite, tapiolite, wodginite-ixiolite and U-rich microlite (Lehmann et al., 2008). Tapiolite and small amounts of ixiolite-wodginite are also common in other pegmatites of the KAB, but U-rich microlite seems to be characteristic of the Gatumba area (Melcher et al., 2015). Some of the pegmatite dykes are noted for their rich variety of phosphate minerals (Daltry & von Knorring, 1998; Araujo et al., 2023), which has been found to be of importance for the local precipitation of Fe-Nb-Ta-rich rutile and columbite-tantalite minerals during respectively the magmatic and the magmatic-hydrothermal stage (Araujo et al., 2023) but these rare phosphates have not been observed as such in the pegmatites of the Gatumba area (Dewaele et al., 2011).
11The Kobokobo mineralized pegmatite in the South Kivu province of the Democratic Republic of the Congo has also been selected for study since it contains important amounts of beryl, columbite-tantalite and cassiterite (Safiannikoff & Van Wambeke, 1967), and the availability of representative samples of this mineralization. This pegmatite follows the axial plane of a strongly folded and lying anticlinal structure composed of partly tourmalinized schists and amphibolites. The pegmatite displays an asymmetrical layered zonation sequence (Safiannikoff & Van Wambeke, 1967) that has been strongly altered by late-stage hydrothermal and supergene activity (Mills et al., 2010). This mineralized pegmatite is of mineralogical and geochemical importance since it contains import local concentrations of Li-Fe-Mn phosphates and Th-U enriched minerals.
Internal zonation and paragenesis of the Nb-Ta-Sn mineralized pegmatites
12The zonal development from the margin towards the center of the pegmatite intrusion has been described in detail for the pegmatites in the Gatumba area (Dewaele et al., 2011; Hulsbosch & Muchez, 2020) and Kobokobo (Safiannikoff & Van Wambeke, 1967) and is considered as very comparable for the pegmatites in the KAB. The first observed zone, starting from the margin towards the center, is a thin border zone, up to 10 cm wide, that consists of fine-grained quartz, albite and microcline with minor blue-greenish apatite and black tourmaline (Hulsbosch & Muchez, 2020), the so-called aplite. Where in contact with other units, large muscovite and tourmaline crystals may develop (Safiannikoff & Van Wambeke, 1967). The following zone, the wall zone, can reach up to several meters and mostly consists of medium-grained quartz, albite, blue-green apatite and muscovite that internally evolves to a more coarse-grained and more anisotropic fabric, where albite may contain mm-sized columbite-tantalite crystals. More internally, large crystals of microcline, up to several meters, occur with irregular accumulations of quartz, muscovite and accessory blue-greenish apatite, black tourmaline and mm-sized cassiterite. The latter is often found in quartz-microcline-plagioclase units with minor muscovite. The next zone, the intermediate zone, can reach a total thickness of 10 meters and is characterized by a continued increase in crystal sizes. Asymmetrical and discontinuous assemblages of microcline-quartz, Li-muscovite-spodumene-quartz and albite-beryl-microcline are characteristic, with quartz and spodumene demonstrating unidirectional solidification textures. Occurrences of large muscovite sheets and tourmaline are analogues to the previous zones. Accessory phases of apatite, cassiterite, Nb-Ta oxides, zircon, uraninite, Li- and Al-phosphates, Li-rich greenish muscovite and native bismuth are mostly disseminated, but may also occur in some small pockets. Isolated dm-sized pockets of quartz-muscovite-cassiterite are more significantly present and their occurrence can extend towards the wall zone. Veins of quartz-muscovite are crosscutting the previous zones. A quartz core zone often with tourmaline, apatite and cassiterite is the most central zone and is sometimes accompanied by polymineralic nodules of a rare variety of phosphates associated with Nb-Ta oxides (Daltry & von Knorring, 1998; Araujo et al., 2023).
13This primary mineralogy and zonal development are often followed by several stages of alteration and fracturing (Fig. 2). Albitization has been recognized as the first stage of alteration, intensively altering primary microcline (Dewaele et al., 2011). Historical literature concerns two phases of albitization (De Clercq, 2012 and references therein), for which the occurrence is controlled by the degree of fracturing rather than the pegmatite composition. The first stage of albitization consists of saccharoidal albite accompanied by the deposition of beryl, spodumene, columbite-tantalite and zircon. The second stage of cleavelandite-type albitization is accompanied by beryl and tourmaline. Albitization is omnipresent in the most evolved pegmatites, between 50–90 vol%, and may completely alter smaller pegmatites (De Clercq, 2012). Next to albitization, sericitization of feldspar followed by muscovitization has been identified as the next alteration event in pegmatite paragenesis (Dewaele et al., 2011; Hulsbosch & Muchez, 2020). Historical literature concerns again two phases of sericitization (De Clercq, 2012 and references therein), but the second one concerns the formation of the replacive greisen pockets. In this late stage, the largest cassiterite crystals are often found to be associated with large muscovite sheets in the so-called ‘greisen’ pockets without a predefined zone within the internal anatomy of the pegmatites (Dewaele et al., 2011; Hulsbosch & Muchez, 2020). A late-stage alteration consists of the formation of rare phosphates, often accompanied by iron (hydr)oxides (Safiannikoff & Van Wambeke, 1967).
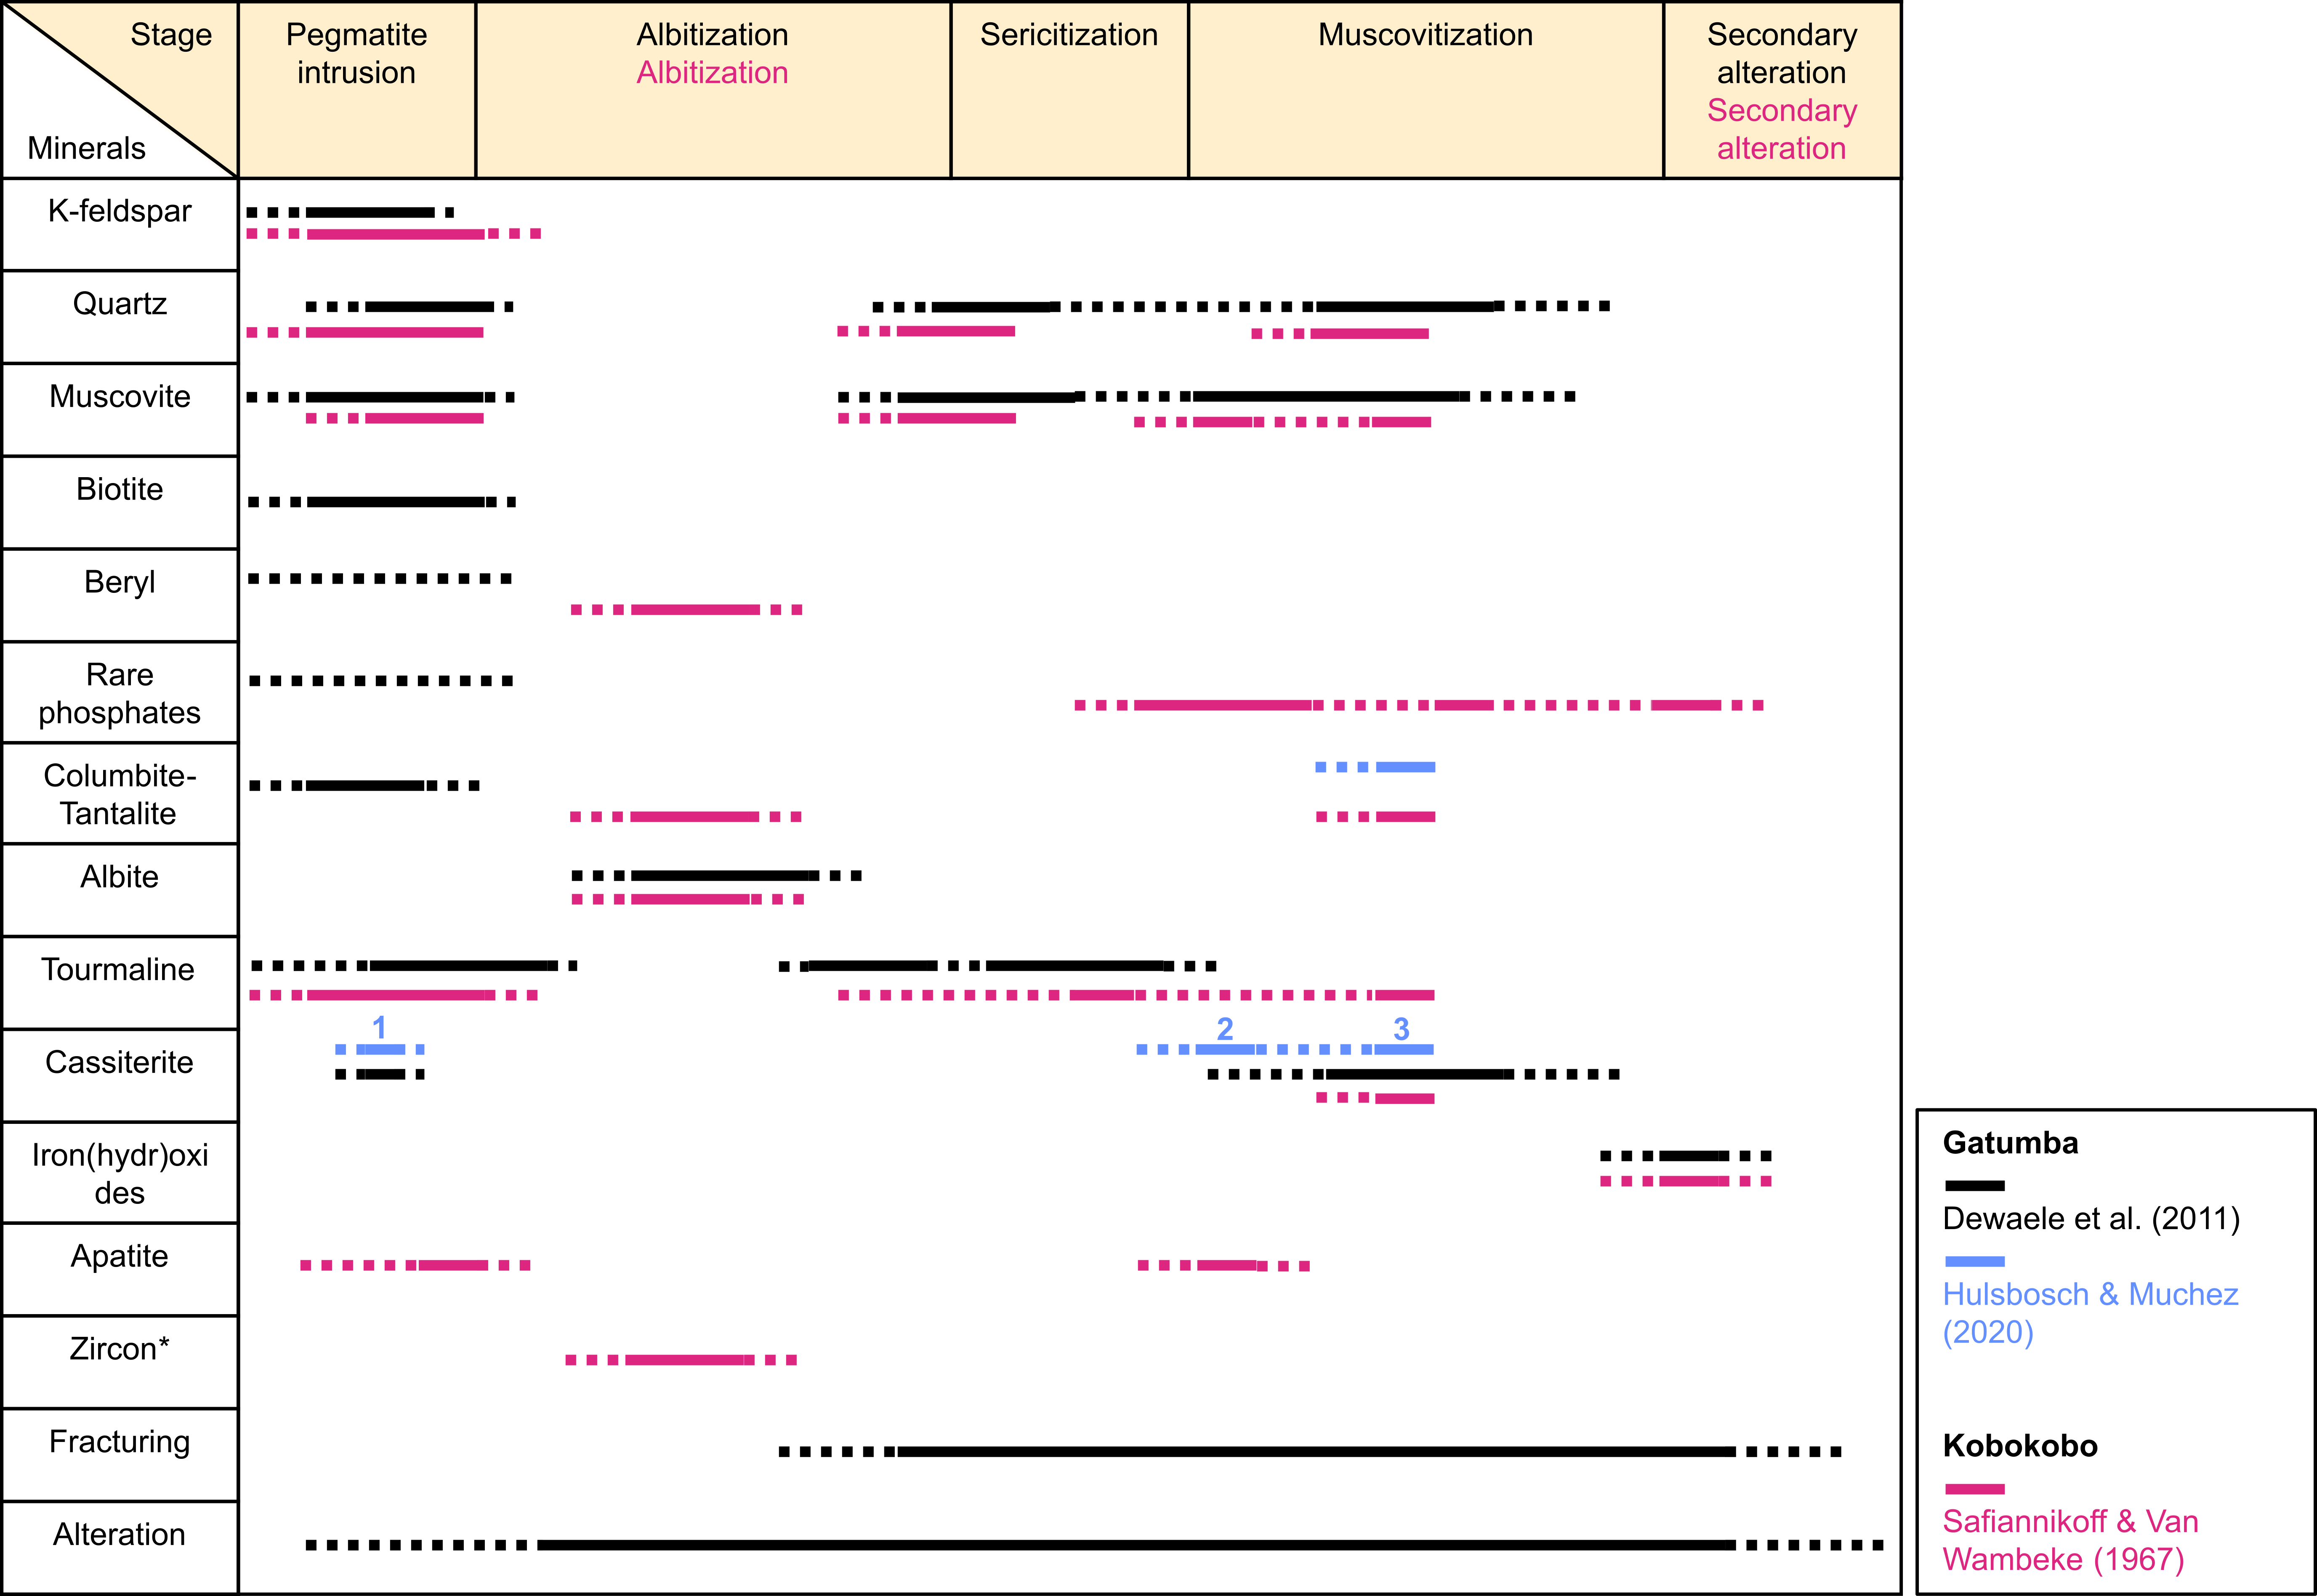
Figure 2. Paragenesis of the Nb-Ta-Sn mineralized pegmatites of the KAB as compiled from Dewaele et al. (2011), Hulsbosch & Muchez (2020) and Safiannikoff & Van Wambeke (1967).
4. Materials
14Samples from the Gatumba area (Dewaele et al., 2011; Hulsbosch & Muchez, 2020) and from the Kobokobo pegmatite (Safiannikoff & Van Wambeke, 1967), which account as representative cases of mineralized LCT pegmatites, were selected out of the sample collections of the Royal Museum for Central Africa (RMCA, Tervuren, Belgium). During the sample selection, emphasis was laid on the presence of the paragenetic steps linked to the formation of the economic mineralization without fully sampling the whole pegmatite. Since irregularly shaped samples are not so suitable to achieve optimum 3D reconstructions with laboratory µCT systems (Kyle & Ketcham, 2015), cylindrical core samples with a diameter of two centimeters and a height of 2.5–4 cm were drilled. The top and bottom of the cylindrical core samples were afterward also polished to be suitable for complementary analyses using optical microscopy and SEM-based AM systems. Polished sections of ore samples from previous research (e.g., Dewaele et al., 2013) were reused to study the diversity of ore minerals and their associated mineral assemblages and to distinguish the different phases of mineralization. Since these samples are embedded in cylindrical epoxy blocks, they are already suitable for µCT measurements.
5. Methodology
15Petrographic investigations of the pegmatite samples were carried out at Ghent University using primarily standard reflected light microscopy and an SEM-based AM system. Polished surfaces were only preliminary investigated using a Nikon Eclipse LV100N POL polarizing petrographic microscopy to identify Sn-Nb-Ta-(W)-bearing ore minerals. The TESCAN Integrated Mineral Analyzer (TIMA-X) equipped with a field emission gun and one energy-dispersive X-ray spectroscope (EDX) was used for the elemental analysis of a sample. This TIMA-X combines calibrated backscattered electron (BSE) images and EDX spectra to establish mineral distribution maps of the polished top and bottom surface of the cylindrical cores (Hrstka et al., 2018).
16Mineral distribution maps acquired with TIMA-X, supplemented by mineralogical observations from previous research (Lehmann et al., 2008; Dewaele et al., 2011; Hulsbosch et al., 2013; Melcher et al., 2015; Hulsbosch & Muchez, 2020), allowed to establish a mineral library compiling the material density ρ and chemical composition of each possible mineral that can be observed throughout the cylindrical cores and the polished sections. This mineral library assists in the identification and interpretation of the 3D mineralogical data.
17High-resolution X-ray computed tomography (µCT) was used to retrieve the 3D distribution of the minerals in the selected zones of the samples. These cylindrical core samples were scanned at the HECTOR scanner at Ghent University (Masschaele et al., 2013) at a tube voltage of 120 kV and 10 W target power. Covering a range of 360°, 2400 projection images were acquired at an exposure time of 1000 ms for each image. The 3D volume is reconstructed using Octopus reconstruction software (Vlassenbroeck et al., 2007). To reduce beam hardening effects, a hardware filter of 1 mm Al is used, and a beam hardening correction has been applied in the reconstruction software. However, the mineral characteristics cannot be retrieved directly from the obtained µCT images. The reconstructed µCT images consist of greyscale values that represent the reconstructed local attenuation coefficients (µrec). The attenuation coefficient is an energy-dependent value that is determined by both the chemical composition and the material density ρ of the minerals. These material characteristics were derived from the handbook of mineralogy (Anthony et al., 2001) and collected in a mineral library. As the attenuation coefficient is energy dependent, the images are strongly influenced by the experimental setup and settings. To quantitatively assess the obtained µrec values, an accurate characterization of the experimental scanning setup is needed, similar to calibrated BSE values in SEM-based AM analyses (Hrstka et al., 2018). For the employed experimental setup (i.e., HECTOR; Masschaele et al., 2013), this is available in the in-house developed simulation tool Arion (Dhaene et al., 2015). Using Arion, for each mineral the µrec value can be simulated for a given setup. The relative difference between the µrec values serves as the most correct guidance to assess the capability of differentiating minerals in the obtained µCT images (e.g., the µrec values of schorl and apatite were here too similar to be distinguished from each other solely based on µCT images). More information about this procedure can be found in Buyse et al. (2023). Image analysis software (Schindelin et al., 2012) with extended machine learning plugins (Arganda-Carreras et al., 2017) was used to distinguish to a certain extent the main mineral phases (e.g., albite, quartz, muscovite, schorl/apatite, dense ore minerals). Three-dimensional interrelationships (co-occurrence) and preferential orientations were calculated for a stack of 2D slices and were measured along 175 predefined directions using statistical descriptors (i.e., respectively the Pearson correlation coefficient and the coefficient of variation) (Buyse et al., 2023), where we are being wary of spurious correlation that might arise (Aitchison, 1982).
6. Results
6.1. Gatumba samples
18The cylindrical core pegmatite samples originating from the most fractioned and evolved stage of the Gatumba pegmatite field consist of a matrix of strongly interconnected quartz and albite and to a lesser extent large, single muscovite fragments (Fig. 3a). The interrelationship between albite and quartz for these samples displays a general negative spatial correlation (Fig. 4a). A less pronounced negative spatial correlation between albite and muscovite exists as well (Fig. 4b). Muscovite may range from cm-sized crystals, which are often surrounded by a small border of albite (Fig. 3a), to sub-mm-sized aggregates. Although the correlation between both phases is mostly negative (Fig. 4b), the spatial correlation is slightly positive in certain directions. These directions coincide with orientations along the longitudinal axis of the cm-sized muscovite crystals (Fig. 5). Tourmaline enriched in Fe, Al and Na and identified as schorl, occurs as grouped mm-sized acicular crystals or as cm-sized individual crystals. Relicts of microcline and beryl, often closely associated, are found throughout the cylindrical cores and display euhedral crystals when occurring within or neighbored by muscovite or schorl. Apatite mostly occurs as dispersed sub-mm-sized crystals in the albite-quartz matrix, but may also occur as a grouped mass. Mineral fragments of albite are incorporated within a fragmented schorl crystal that is in turn incorporated within a muscovite crystal that mimics the shape of the schorl crystal (Fig. 6a). This sample was later repolished to verify the identification of minerals using SEM-EDX and which brought to the light that a fragment of quartz was also incorporated within the schorl crystal. Microscopic observation showed that the observed muscovite crystals within this assemblage display a grey color, while the large muscovite fragments throughout the sample are rather greenish brown in color. Veinlets of barite are sparsely observed within and oriented along the {001} cleavage of muscovite crystals (Fig. 6b).
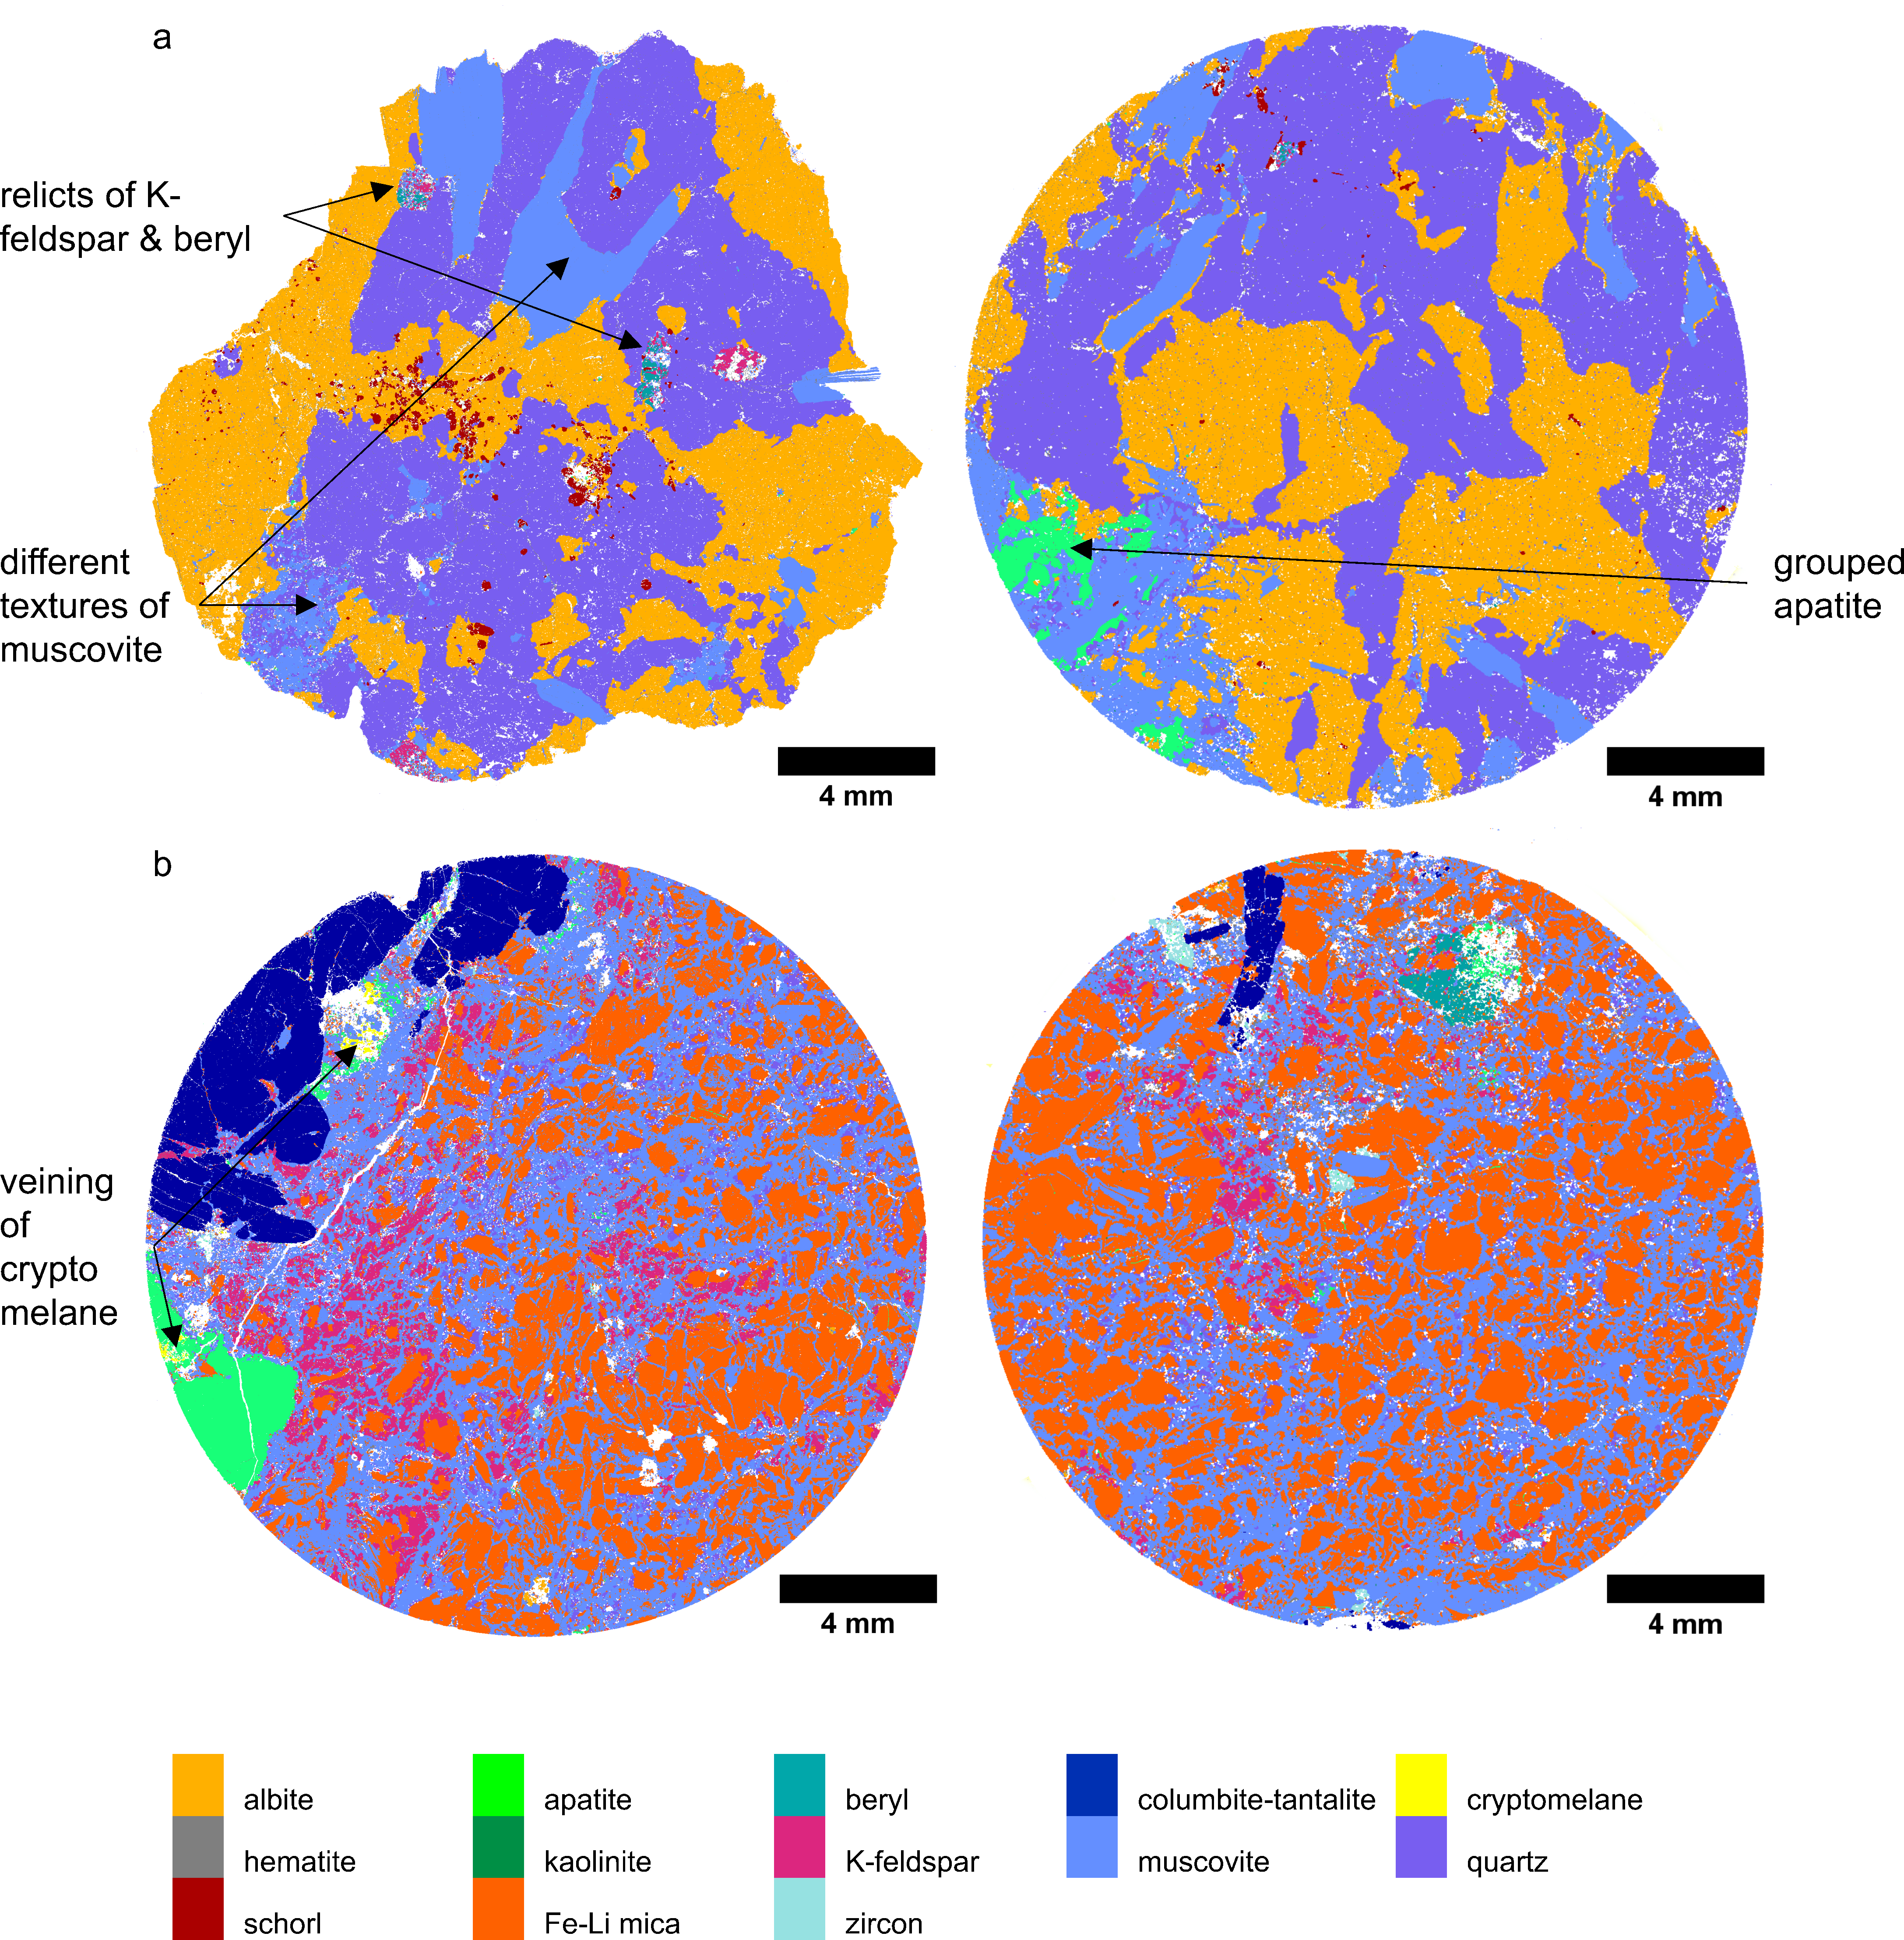
Figure 3. Mineral distribution maps of samples originating from a. the Gatumba area and b. the Kobokobo pegmatite.
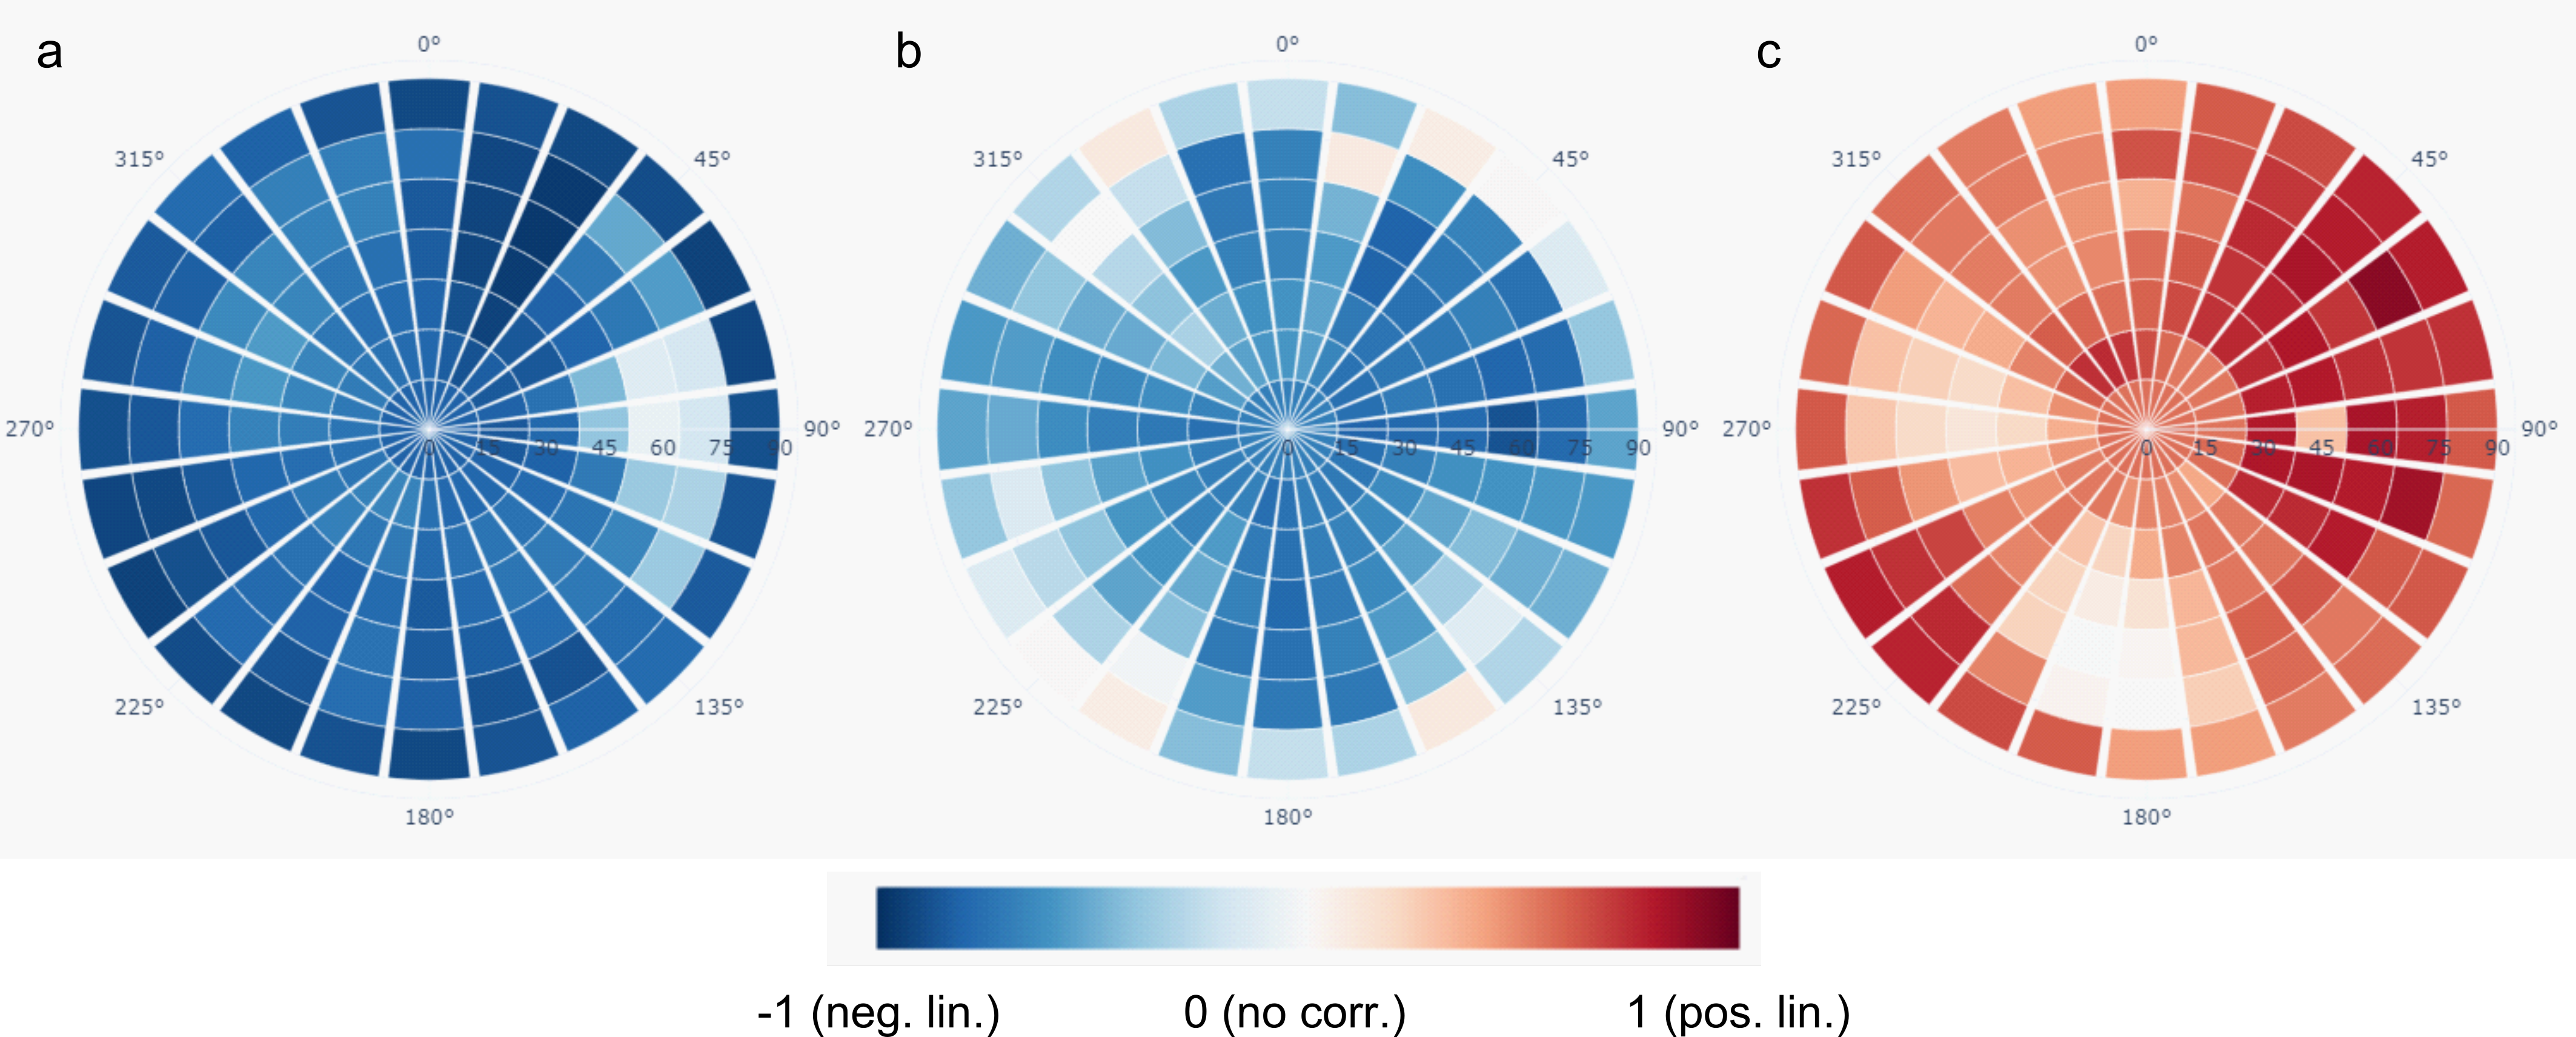
Figure 4. Spatial correlation between a. albite-quartz, b. albite-muscovite and c. schorl/apatite-dense minerals along different directions (adapted from Buyse et al., 2023). An absolute value of one for the Pearson correlation coefficient would mean that there is a perfect spatial correlation between two mineral phases (this can be either a positive or negative linear correlation).
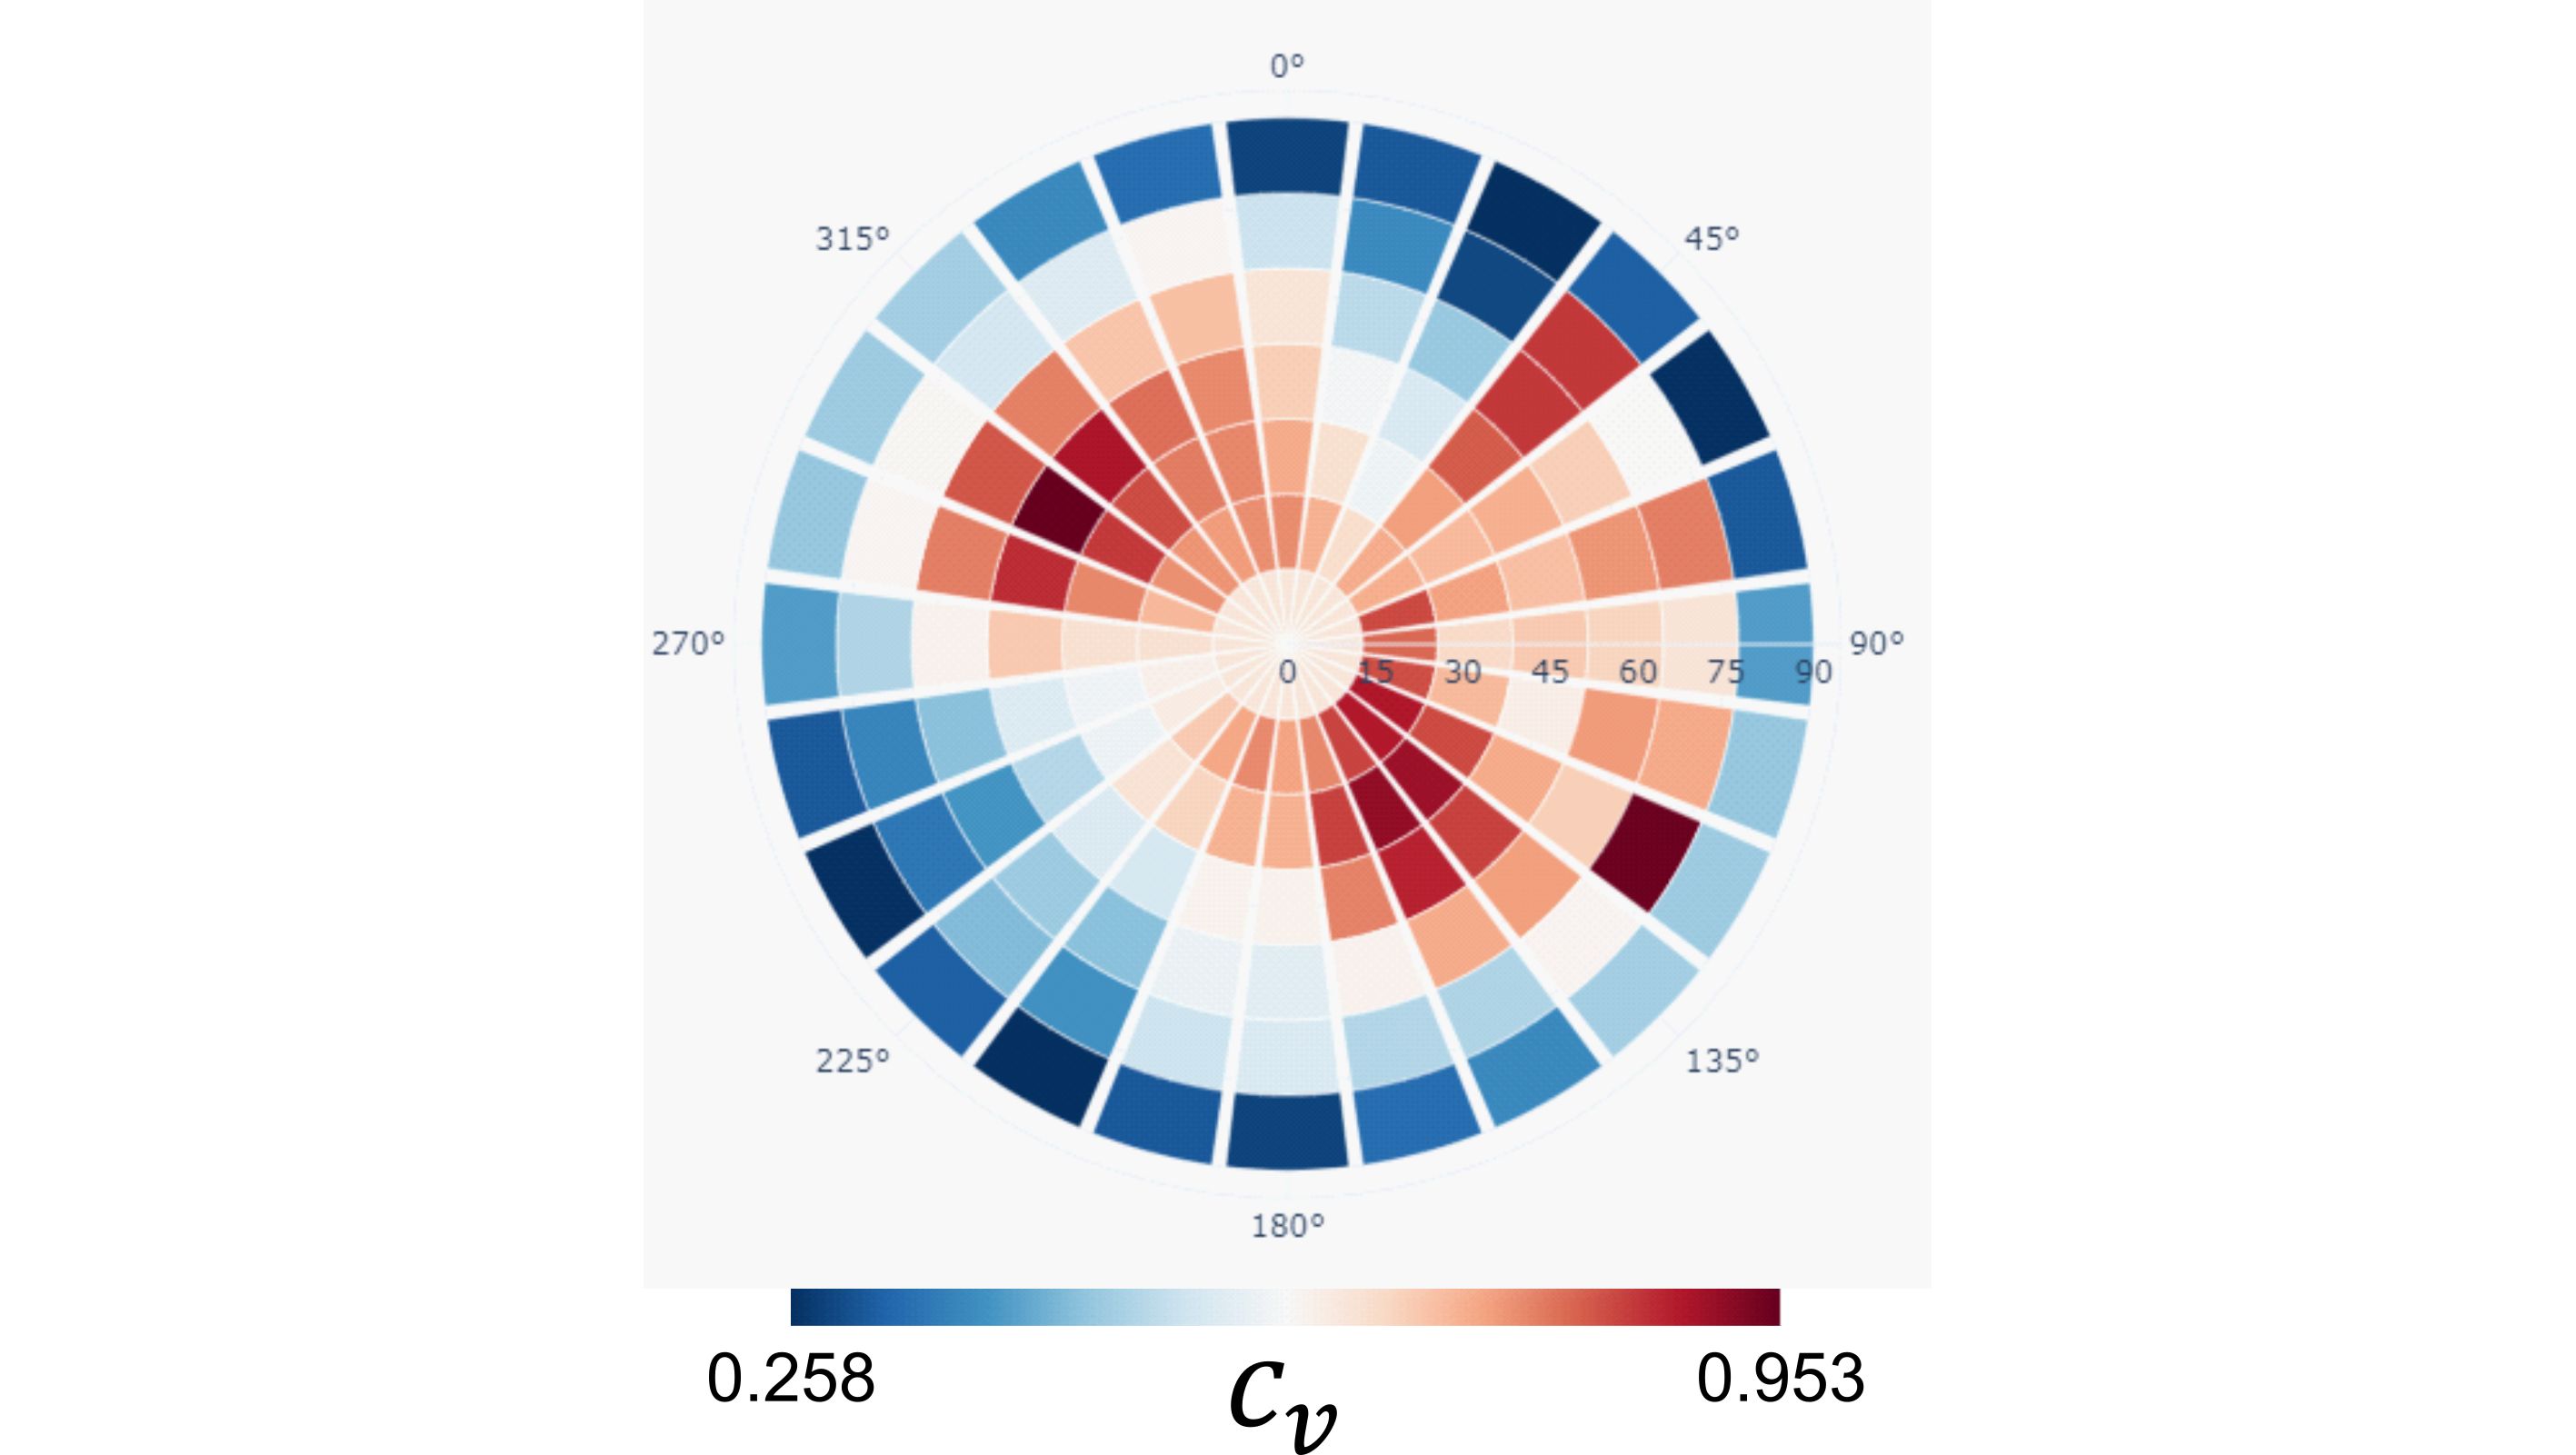
Figure 5. The preferential orientation of muscovite is expressed by the coefficient of variation cv, where higher values are obtained perpendicular to the preferential orientation (adapted from Buyse et al., 2023). Differences in the coefficient of variation along certain directions would mean that there is a preferential orientation of the mineral phase (lower values are then obtained along the preferred orientation(s)).
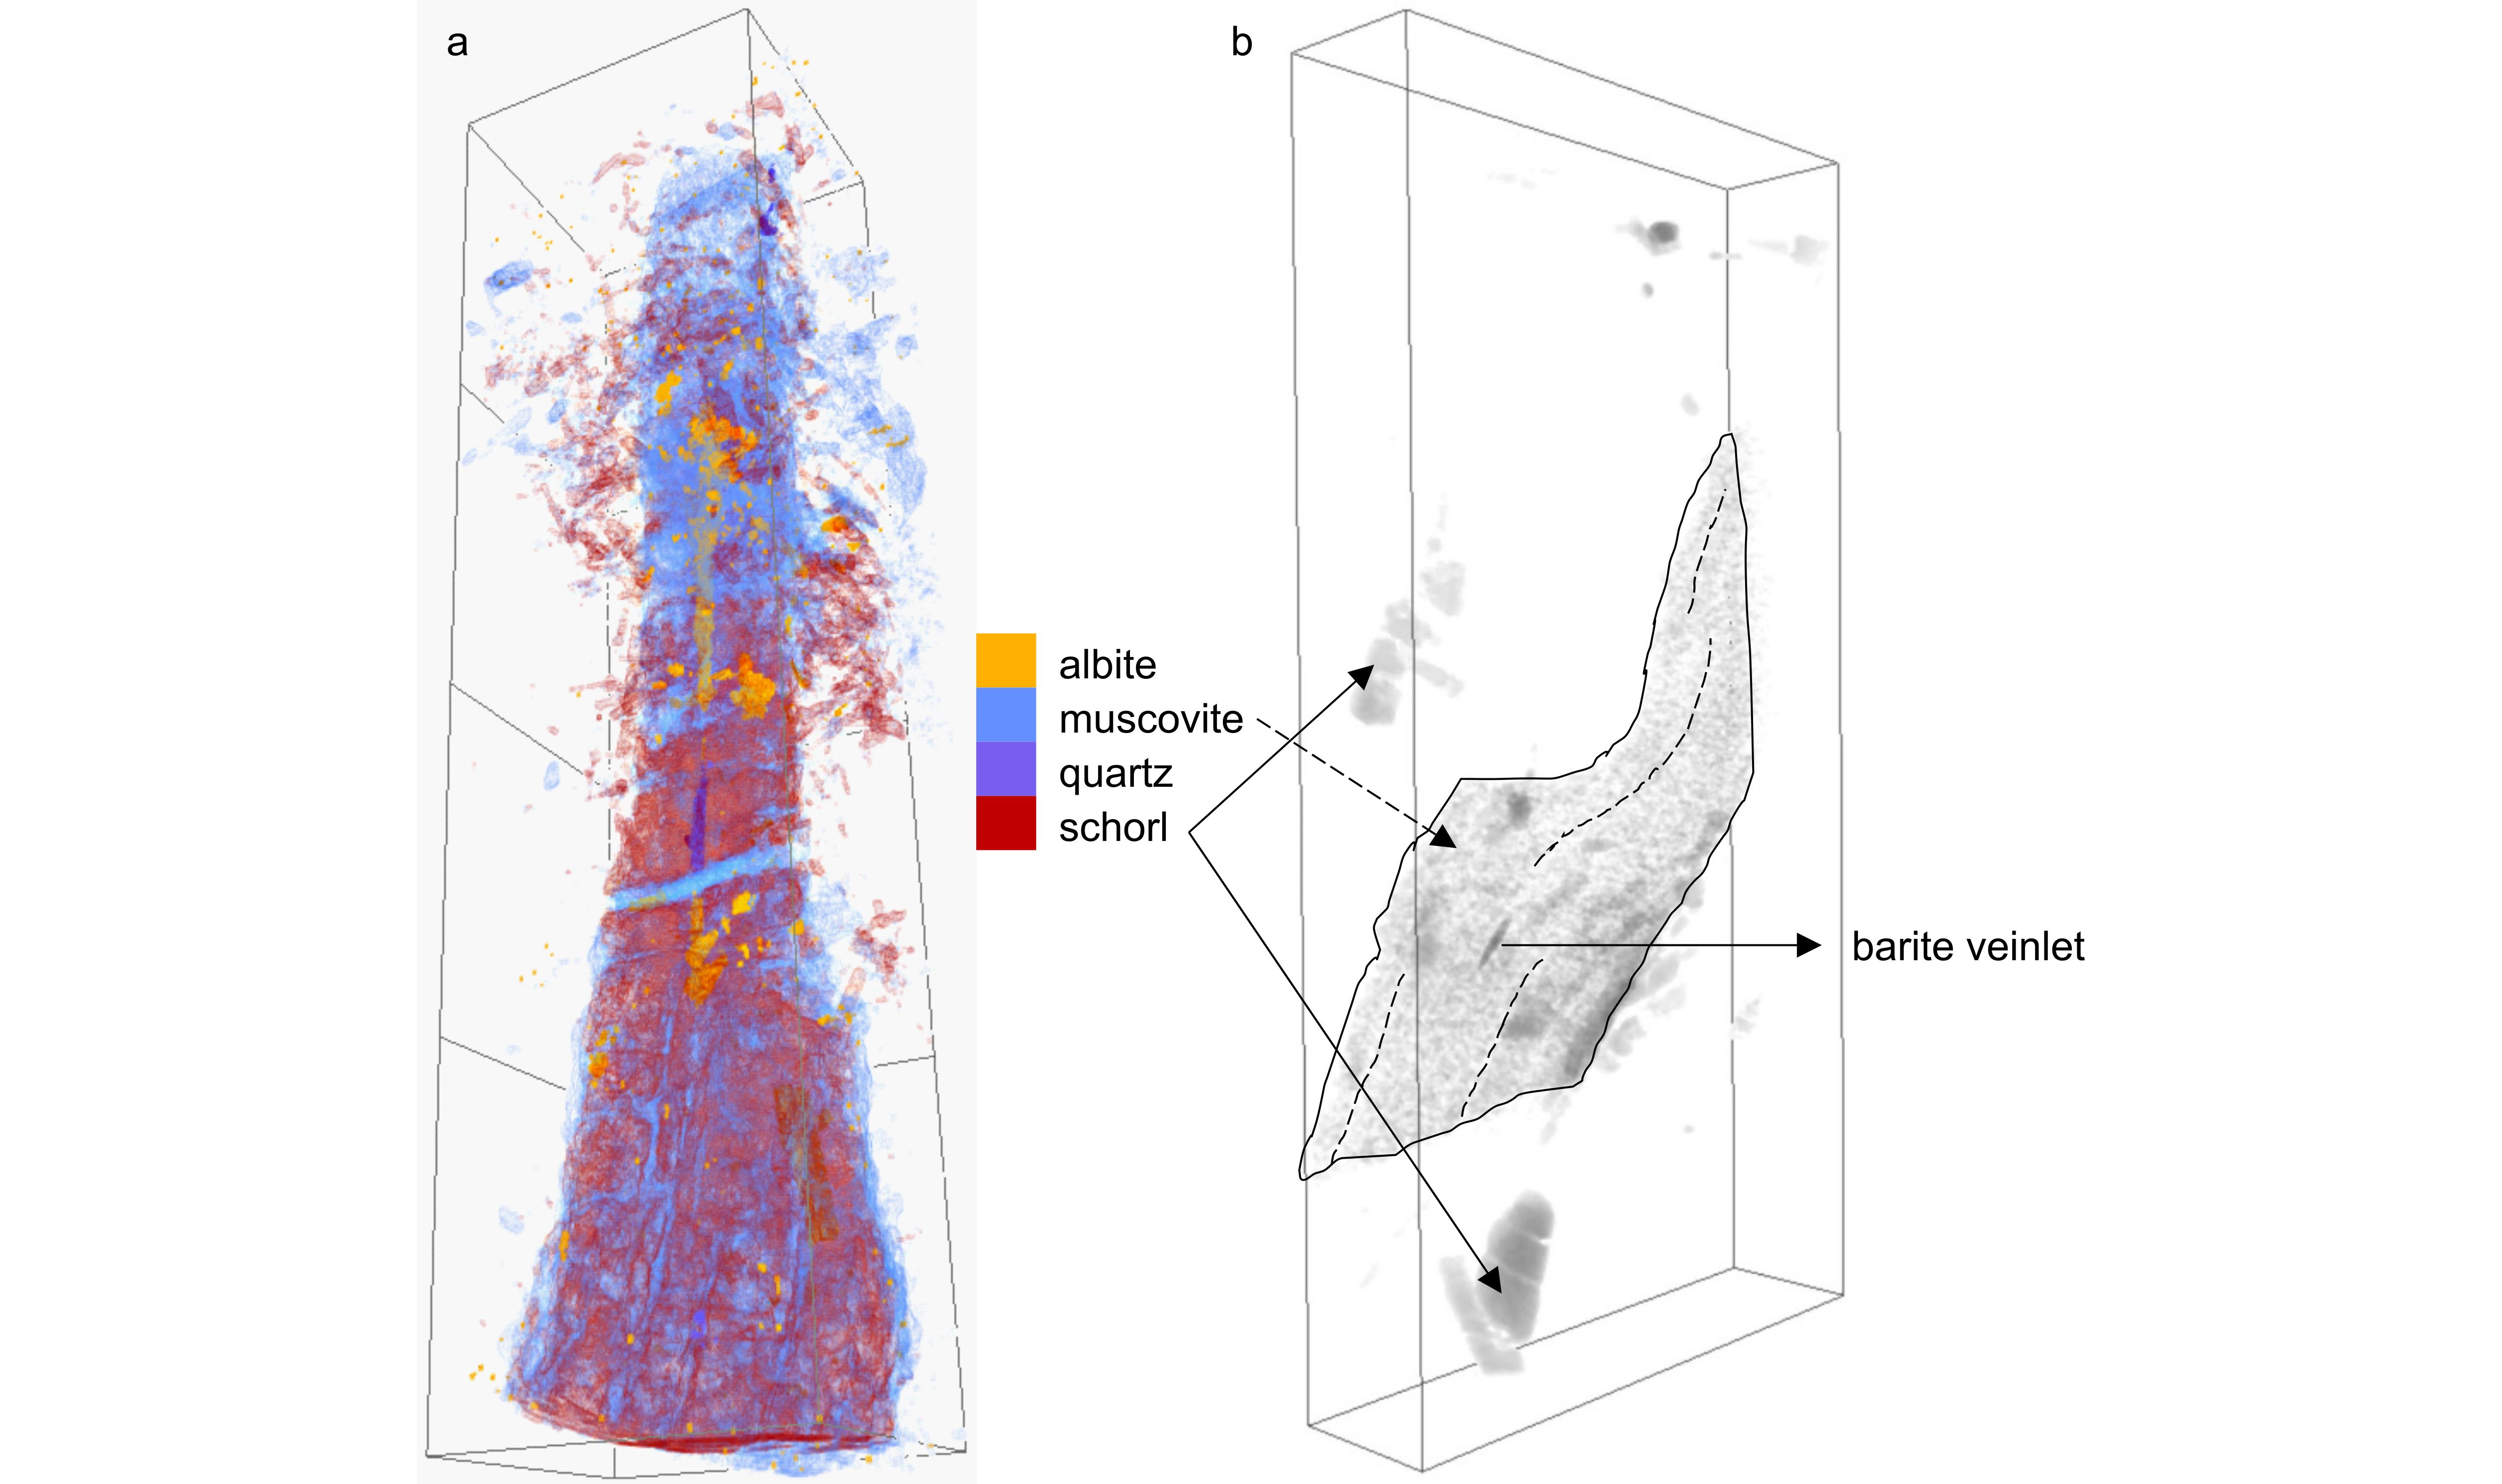
Figure 6. Three-dimensional visualization of µCT observations for Gatumba samples. a. Assemblage of albite, quartz, muscovite and schorl (box = 20x5x5 mm) (adapted from Buyse et al., 2023). b. Inclusion of barite veinlet oriented along the cleavage (dashed lines) of a muscovite grain (box = 8x4x1 mm).
19One Nb-Ta-U oxide and multiple zircon crystals were found to be associated with a stellate aggregate of muscovite that is strongly intergrown with grouped apatite minerals (see Fig. 3a). It is this spatial association that caused the positive correlation between schorl/apatite and dense mineral (Fig. 4c). This positive correlation can thus be traced back to a correlation between apatite and zircon. Furthermore, occurrences of columbite-tantalite were restricted to µm-sized crystals within the matrix or closely associated with muscovite. Cassiterite has not been observed by µCT analyses within the prepared cylindrical core pegmatite samples originating from the Gatumba pegmatite field. However, it was observed within polished sections of ore samples with a distinct tri-mineral assemblage of quartz-muscovite-cassiterite that were afterward scanned with µCT. These cassiterite crystals display well-developed elongated faces within this assemblage (Fig. 7).

Figure 7. Habitus of cassiterite minerals as observed with µCT from a polished section of a distinct tri-mineral assemblage of quartz-muscovite-cassiterite (box = 10x10x5 mm).
6.2. Kobokobo samples
20The studied Kobokobo samples consist of a muscovite matrix containing crystals of Fe-Li mica, microcline and a heterogeneous distribution of columbite-tantalite, apatite, beryl and zircon grains (Figs 3b, 8a–b). Tourmaline has not been observed. Special attention has been spent on the occurrence of beryl and apatite. Beryl and apatite are, opposed to the Gatumba pegmatite sample, here present as cm-sized grains. Apatite also contains substantial amounts of Mn, as opposed to the apatite grains from the Gatumba samples. Apatite and beryl may contain grains of Fe-(Li) mica, emplaced in the muscovite matrix.
21Fracturing and mm-sized veining is observed throughout the samples. Some of the fractures only seem to affect specific mineral fragments, especially Fe-Li mica (Fig. 8b) and columbite-tantalite, but also microcline and albite. Other fracture systems affect both mineral fragments and the muscovite matrix in which they are embedded. Where the veins affect Fe-Li mica grains, they align with their {100} cleavage. The fractures are mainly filled with Mn-Fe-oxides and Ca-Fe-phosphates. Although these are usually called Mn-Fe-oxides, they are mainly Mn-oxides accompanied by Fe-oxides. Mn-Fe-oxides occur within Fe-Li mica and columbite-tantalite, while Ca-Fe-phosphates seem to affect the whole sample.
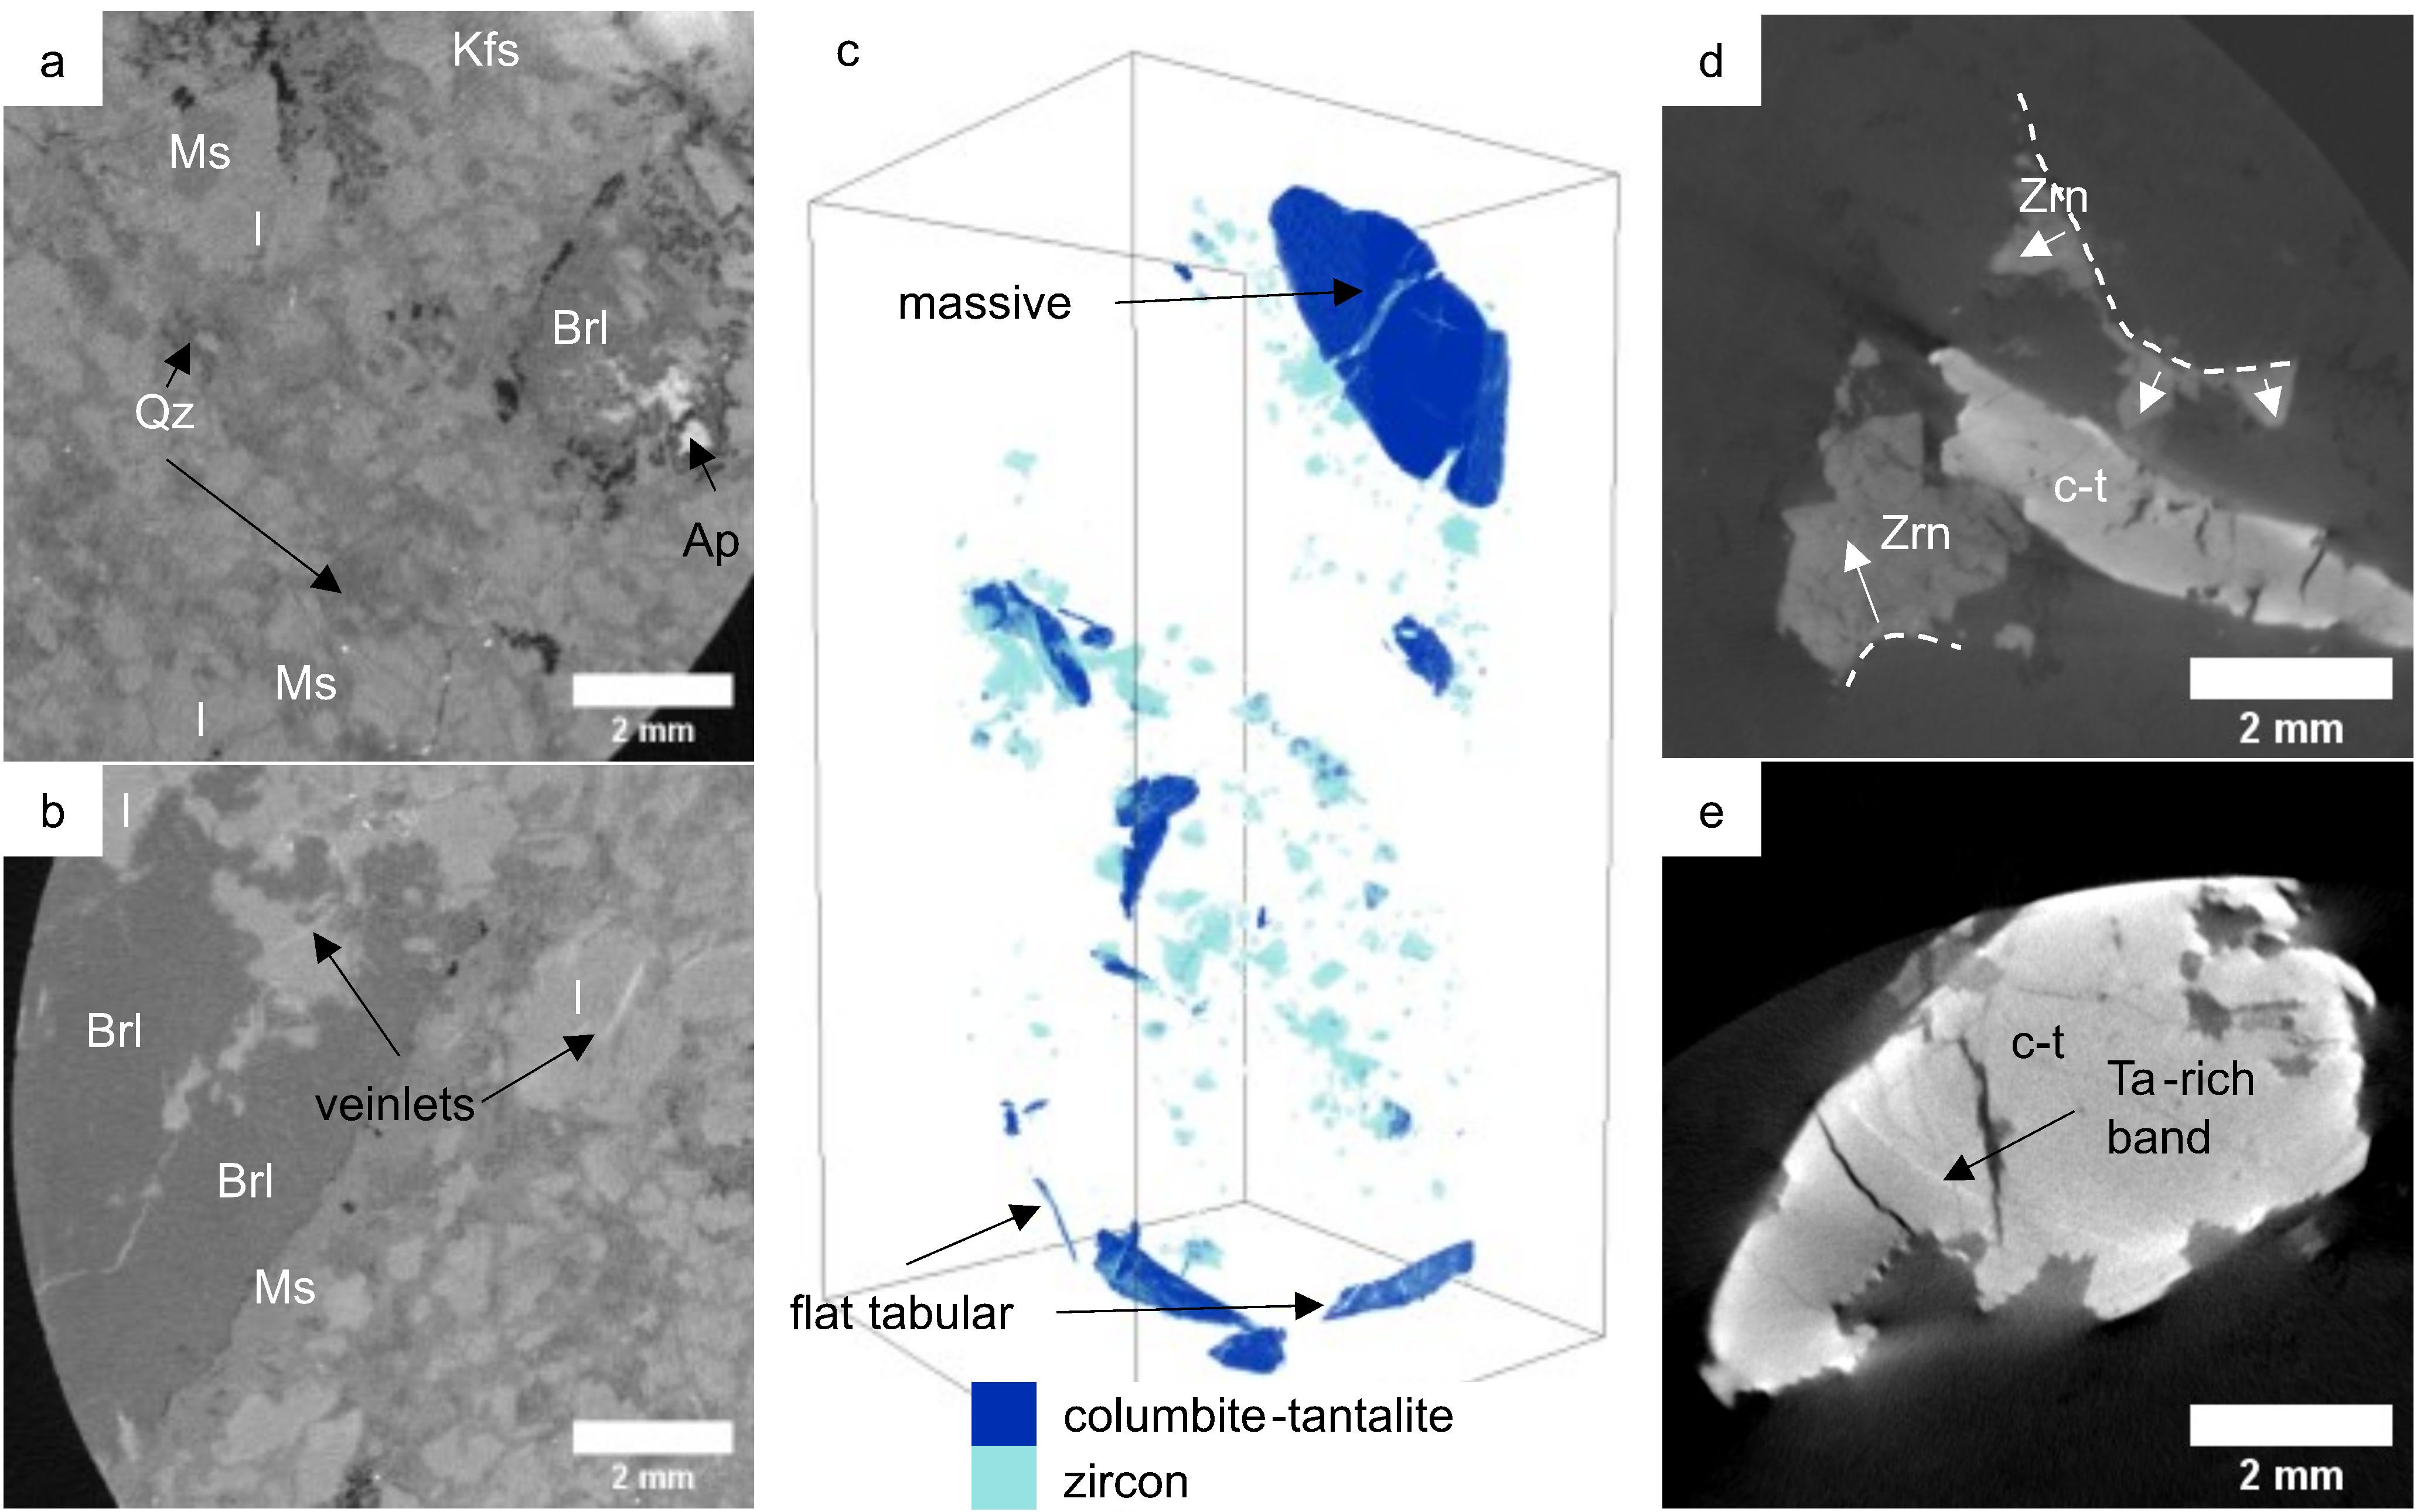
Figure 8. Mineral relationships for samples of the Kobokobo pegmatite as observed from µCT data. a–b. Overview of some general textures that were observed in the pegmatite samples. c. 3D visualization of columbite-tantalite and associated zircon (box = 40x20x20 mm). d. Directional growth of zircon grains with associated columbite-tantalite as observed from µCT images. e. Oscillatory zoning of Nb-Ta in µCT image due to varying µrec values that mainly reflect differences in Nb/Ta of columbite-tantalite. Ap = apatite, Brl = beryl, c-t = columbite-tantalite, Kfs = K-feldspar, l = Fe-Li mica, Ms = muscovite, Qz = quartz and Zrn = zircon.
22Nb-Ta minerals are here present as large columbite-tantalite grains that display distinct zoning, whether in SEM-EDX images (Fig. 9) or in µCT images (Fig. 8e). They may occur as massive or as thin blade-shaped crystals and seem to be spatially associated with zircon crystals (Fig. 8c–d). The observed zoning of columbite-tantalite differs for the different components. The Fe-Mn component is irregular and patchy in nature and the Nb-Ta component displays distinct oscillatory zoning (Fig. 9). The zircon crystals, frequently containing uraninite inclusions, often display directional growth (Fig. 8d).
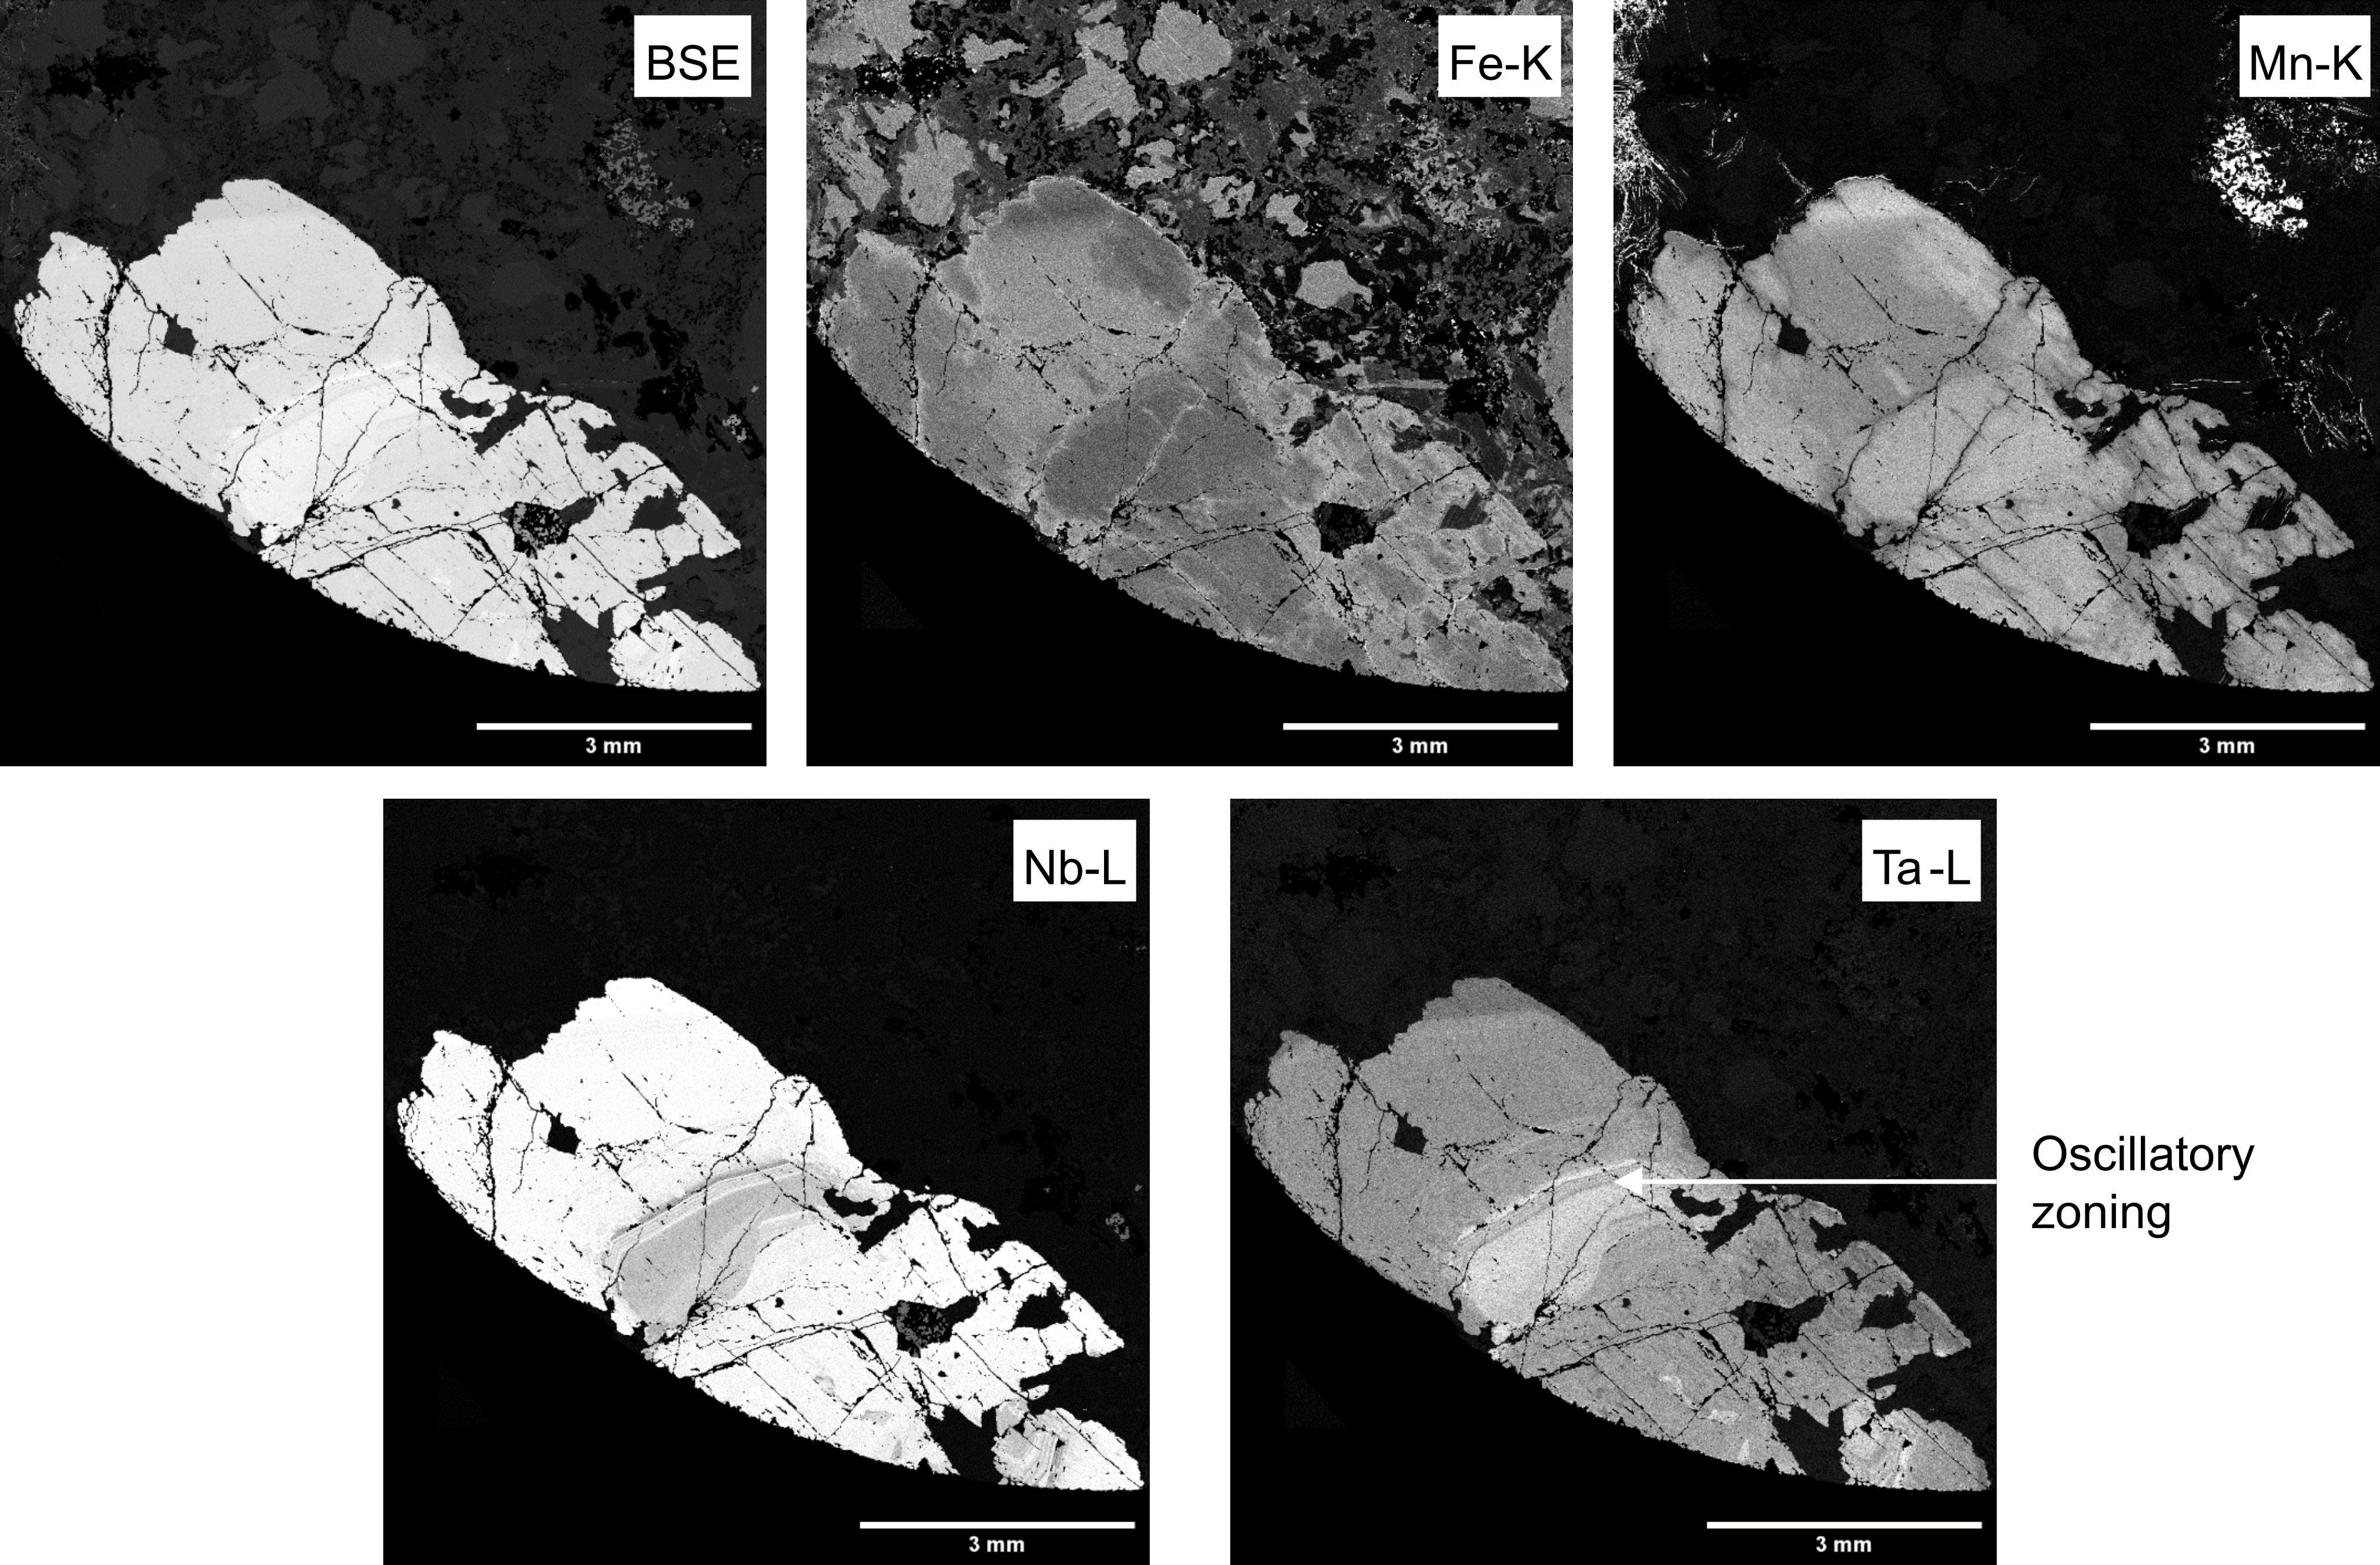
Figure 9. BSE-EDX mapping of a columbite-tantalite mineral displaying both patchy and oscillatory zoning. Zoning in the BSE image mainly reflects the differences from the characteristic L-lines of Nb and Ta, which can also be seen from µCT images (see Fig. 8e).
7. Discussion
23The Gatumba samples studied can be classified, based on their mineralogy and texture, as originating from the intermediate zone, notwithstanding that they have been strongly altered by magmatic-hydrothermal and later fluids (Dewaele et al., 2011; Hulsbosch & Muchez, 2020). The pegmatite samples consist of a matrix of strongly interconnected quartz and albite and to a lesser extent large cm-sized, single muscovite fragments (Fig. 3a). The near complete replacement of albite after microcline is observed within these samples, typical for this zone (Dewaele et al., 2011; Hulsbosch & Muchez, 2020). Relicts of microcline, often together with beryl, were only identified as minor components. Muscovite occurs mainly as large scaly/isolated fragments, and not as large masses typically encountered in the greisen pockets, typical for the later muscovitization event (Dewaele et al., 2011).
24The Kobokobo samples consist of a muscovite matrix containing crystals of Fe-Li mica, microcline and a heterogeneous distribution of columbite-tantalite, apatite, beryl and zircon grains (Fig. 3b). Historically, these samples were attributed to the albite stage of Safiannikoff & Van Wambeke (1967). Based on the important amounts of beryl, apatite, columbite-tantalite and zircon present, these pegmatite samples could also be classified as originating from an intermediate zone of a pegmatite system (Dewaele et al., 2011). These samples have also been strongly altered, similar to the samples of the Gatumba area. However, it should be noted that the Kobokobo samples still contain a vast amount of unaltered microcline, with only minor amounts of secondary saccharoidal albite.
25Compared to the previous petrographic observations from Dewaele et al. (2011) and Hulsbosch & Muchez (2020), a dark-colored Fe-Li mica has in addition been observed. This mineral does not correspond to broken fragments of black tourmaline in Kobokobo (Safiannikoff & Van Wambeke, 1967), nor to the biotite described in the Gatumba pegmatites (Dewaele et al., 2011). Although the Li-content of these minerals has not been directly measured by standard SEM-EDS, since the elemental range of EDX analyses is limited from beryllium to uranium, this mineral has been identified as a Fe-Li mica by the combination of SEM and µCT analyses (Buyse et al., 2023). Based on these analyses, this mineral most possibly belongs to the siderophyllite-polylithionite series. Li-bearing mica minerals like lepidolite and zinnwaldite (intermediate siderophyllite-polylithionite solid solution) are common mineral phases in cassiterite and topaz-bearing pegmatites (Dill, 2010) and lepidolite is also described as being incorporated in the albitized Gatumba pegmatites (Hulsbosch et al., 2013). The origin of Fe-Li micas can still be traced back to biotite, as metasomatic biotite can accommodate Rb, Cs and Li, leading to rare-alkali enriched siderophyllite-polylithionite series (London, 2018). Although not of high significance, the elemental map of the characteristic Cs L-line also reaches higher concentrations in the observed Fe-Li micas. Cesium might have been redistributed during an earlier albitization stage of microcline (Hulsbosch & Muchez, 2020). More detailed chemical mapping of these Fe-Li micas is required to reveal their detailed chemical zoning and evolution, but this further supports the fact that these pegmatites belong to the LCT family.
26The proportion of quartz is known to become more important in the intermediate zone going towards the core zone (London, 2018). This has previously also been described in the Gatumba area based on macroscopic observations (Dewaele et al., 2011; Hulsbosch & Muchez, 2020). A strong negative spatial correlation between albite and quartz (Fig. 4a) points here to their strong proportional competition during the internal evolution of the pegmatite within the intermediate zone as well. As observed before in the intermediate zone, microcline has been nearly completely albitized. The apparent competition between albite and quartz is thus actually a competition between albitized primary microcline and quartz. The proportional competition is non-directional and thus does not explain the directional evolution to a quartz core at this scale. Besides, the unidirectional solidification textures for quartz in the intermediate zone (Hulsbosch & Muchez, 2020) have not been identified at the microscopic scale for quartz here.
27Albitization is the first stage of alteration that follows the primary crystallization of the pegmatite (Dewaele et al., 2011). The intermediate zone is partly to near-completely affected by cleavelandite-type albitization after microcline (Hulsbosch & Muchez, 2020). Since microcline has been described to contain important amounts of Rb and Cs (Hulsbosch et al., 2014), albitization was postulated to be a significant process to redistribute rare alkali metals between fluids and mineral phases (Hulsbosch & Muchez, 2020). Muscovite grains were often observed to be surrounded by a small border of albite in both BSE images (Fig. 3a) and in µCT data. However, the quantification of the negative spatial correlation between albite and muscovite (Fig. 4b) together with the preferential orientation of muscovite grains (Fig. 5) postulate that muscovite grain boundaries are, on their part, inert to albitization as secondary micas are formed and mica is inside the stability field during alteration (e.g., Leichmann et al., 2009). However, they may serve as pathways and/or barriers for hydrothermal fluids and associated mineralization. Relicts of microcline, unaffected by albitization, were for example also found to occur within or neighbored by muscovite or schorl grains, favoring the role of muscovite as barriers during albitization. Large Cst3 crystals are often associated with muscovite sheets in greisen pockets (Dewaele et al., 2011; Hulsbosch & Muchez, 2020) and the associated fluids were Cs-enriched as well (Hulsbosch & Muchez, 2020), the muscovite sheets probably influenced the fluid migration and precipitation of Cst3.
28Greenish-brown colored muscovites are often found in the matrix of albitized and thus mineralized pegmatites (Dewaele et al., 2011). The observed muscovite grains occur mainly as large isolated fragments in the matrix, but not as large as the recrystallized sheets typically encountered in the greisen pockets (Dewaele et al., 2011). Nevertheless, small veinlets of barite were observed within these muscovite grains (Fig. 6b). A study on pegmatites from NE Bavaria (Germany) (Dill et al., 2011), which has been taken as a reference for barium-enriched pegmatites, demonstrated that barium can be accommodated as barite under high sulfur fugacity in the magmatic-hydrothermal transition stages of pegmatites. Since these muscovite grains are often found to be fully surrounded by albite, and thus are not the result of sericitization followed by muscovitization (Dewaele et al., 2011; Hulsbosch & Muchez, 2020), they must have been formed during a late stage magmatic-hydrothermal evolution of the pegmatite crystallization (at the end of the albitization stage in Fig. 2).
29Mineral fragments of quartz-albite that are incorporated in the schorl fragment (Fig. 6a) are interpreted to belong to the primary pegmatite intrusion (Fig. 2). However, these euhedral albite crystals formed here after the albitization of primary microcline. This albite is interpreted to belong to the first phase of (saccharoidal) albitization as it is not contemporaneous with schorl (De Clercq, 2012). The assemblage of quartz-albite-schorl has later been broken into fragments and incorporated in newly formed greyish muscovite. The observed grey and greenish-brown muscovite colors correspond well with previous observations of respectively muscovite in greisenized rocks and muscovite in mineralized pegmatites of the Gatumba area (Hulsbosch et al., 2013). Dark green and yellow micas have previously also been ascribed to be Li-bearing micas (Safiannikoff & Van Wambeke, 1967; Hulsbosch et al., 2013), but the Li-content in this muscovite takes, based on deviating oxide sums (Hulsbosch et al., 2013), only up to some weight percentages and is highly uncertain. Taking the assemblage of Figure 6a into consideration, this would mean that a stage of tourmaline crystallization followed a stage of saccharoidal albitization, but which occurred before the fragmentation and the later sericitization and muscovitization of the schorl fragment. In addition to feldspar, tourmaline is also known to be sericitized in the presence of K+ residual fluids and may react directly to form muscovite in pegmatites (Ahn & Buseck, 1998). As albite is also surrounding this assemblage, a second stage of cleavelandite-type albitization followed the tourmaline crystallization and the late magmatic fluids of the second albitization could have caused the sericitization-muscovitization of schorl. The albitization stage in Figure 2 should therefore be divided into two stages of albitization, before and after tourmaline crystallization.
30A distinct quartz-muscovite-cassiterite assemblage in one of the polished sections is characteristic of the isolated greisen pockets that mainly occur randomly distributed within the intermediate zone of the pegmatites (Dewaele et al., 2011; Hulsbosch & Muchez, 2020). The crystal morphology of cassiterite has been identified to be useful for a rough classification as it varies in time and space as a function of temperature (Cuff & Taylor, 1979; Dill, 2010) and allows to estimate the possible depth of distribution and magnitude of mineralization at the exploration stage (Vdovina, 2019). The observed ‘Cornish Type’ (i.e., bipyramidal crystals with well-developed elongated faces of the prisms) from µCT images (Fig. 7) is known to be formed during hydrothermal (mesothermal conditions: 200–300 °C) (Dill, 2010). This is in good agreement with a fluid inclusion study on quartz and cassiterite (Cst3) originating from greisen pockets (Hulsbosch & Muchez, 2020), which shows a homogenization temperature of ~285 °C. Crystallographic investigations in 3D using µCT offer a means to roughly assess the conditions under which minerals and thus different depositional stages were formed.
31The observed fracturing and veining systems of alteration can be subdivided into two generations. The first generation of Mn-Fe oxides affects isolated primary mineral fragments (i.e., Fe-Li mica and columbite-tantalite), that are present in a younger muscovite matrix. It can be observed that the veining is restricted to these fragments without any connection to a veining system throughout the samples. Apatite in the Kobokobo samples was demonstrated to contain a substantial amount of Mn, which was previously only observed for apatite in the core zone of pegmatites from the KAB (Hulsbosch & Muchez, 2020). Since apatite may be associated with primary Fe-Li micas, it can be classified as one of the primary mineral fragments that were later emplaced in a muscovite matrix. The incorporation of the Mn and Fe in the veining system can, therefore, be linked to their availability from columbite-tantalite and Fe-Li micas and so this generation of veining occurred prior to the muscovitization of the matrix. The second generation of Ca-Fe phosphate veining is affecting both the mineral fragments as well as the muscovite matrix. The nature of the polymineralic phosphate nodules in Araujo et al. (2023) is rather dike specific, to be able to compare with this generation of phosphate veining. The mobility of phosphate can here directly be linked to the occurrence of apatite as the veins are often connected with apatite throughout the samples. The second generation of veining coincides with the late-stage alteration as noted in Safiannikoff & Van Wambeke (1967) (Fig. 2) whereas the first generation of Mn-Fe-oxides can now rather be placed right after and/or concurrent with the formation of columbite-tantalite.
32The oscillatory zoning of Nb-Ta is the dominant zonation within a given pegmatite. The patchy zonation of Fe-Mn (Fig. 9) is independent of the zoning of Nb-Ta and suggests co-crystallizing minerals to compete for Mn and Fe (Fuchsloch et al., 2019). Low element mobility of Nb-Ta in the presence of fluids could explain the unaffected zoning of Nb-Ta, while the patchy replacement of Fe-Mn could be interpreted to result from remobilization in the presence of fluids (Van Lichtervelde et al., 2007). In Araujo et al. (2022), Fe and Mn are remobilized from phosphates to the residual melt and may locally precipitate Nb-Ta oxides at the magmatic-hydrothermal stage. Here, the texture of zircon is similar to comb structures as a result of deposition from hydrothermal solutions (Craig & Vaughan, 1994). Oriented textures are known to be promoted by liquidus undercooling and are not necessarily similar to their euhedral habitus (London, 2008), but to the best of our knowledge occurrences like this have so far not been described for zircon in literature. The zircon crystals have previously been described as cyrtolite for the Kobokobo deposit (Safiannikoff & Van Wambeke, 1967). This is a former name used to describe a hydrous Th-U-bearing zircon that may form curved, rounded crystals and was found to be often associated with beryl and columbite-tantalite (Safiannikoff & Van Wambeke, 1967). Despite crystallization from possible fluid-melt interactions, they may still maintain purely magmatic textures (Van Lichtervelde et al., 2009; McNeil et al., 2020). The close spatial association between the aforementioned zircon and columbite-tantalite crystals has been observed in this study as well (Fig. 8c–d) and suggests a magmatic-hydrothermal origin of the latter. This could explain the occurrence of both massive and flat tabular columbite-tantalite grains (Fig. 8c) throughout the samples.
33The occurrence of an Nb-Ta-U oxide, previously described by Lehmann et al. (2008) as a U-rich microlite, is the least abundant mineral of the Nb-Ta mineral phases. However, it can be locally concentrated (Lehmann et al., 2008) and has been described to be characteristic of the Gatumba area (Melcher et al., 2015). Microlite is often interpreted to be metasomatic or late-stage hydrothermal and may fully replace columbite-tantalite grains (Van Lichtervelde et al., 2007; Kaeter et al., 2021) and can be concerned here as the result of a fully altered columbite-tantalite grain.
34However, as the selected cylindrical core samples often lacked any mineralization, further refinement of the mineralization events was not elaborately studied. To explore this more in detail, larger samples should in the future be scanned on the occurrence of mineralization zones prior to the selection and preparation of cylindrical core samples. In addition, a cylindrical core that is extended in length would be required to observe the evolution of the zonation sequence across an individual pegmatite dyke or to investigate possible pathways and reactions that lead to the apparent random distribution of greisen pockets within the intermediate and wall zone (Dewaele et al., 2011; Hulsbosch & Muchez, 2020). Once familiar with the studied mineral deposit, and thus with its mineral content, this methodology does not require elaborate preparation of the samples as the relative difference between µrec values from µCT data provides a means to differentiate between minerals in 3D (Bam et al., 2020; Buyse et al., 2023). Only where the relative difference between µrec values is too low, samples will still need to be cut and repolished to investigate with an SEM-based AM system. A promising technique that is capable of retrieving elemental information for qualitative identification, without the need for elaborate sample preparation, is laser-induced breakdown spectroscopy (LIBS) (Baele et al., 2021). Other techniques that may assist in the identification of minerals, without any need for further sample preparation, is the use of specialized detectors in laboratory-based CT systems such as X-ray fluorescence tomography (Laforce et al., 2016) and spectral tomography (Sittner et al., 2022) to retrieve direct 3D chemical imaging.
8. Conclusions
35The 3D automated mineralogy assisted in the identification of minerals (e.g., identification of Fe-Li mica and the inclusion of a barite veinlet in a muscovite grain) and the localization of key mineral assemblages that further helped to refine the paragenesis of mineralized pegmatites in the KAB. An important observation from µCT data is a mineral assemblage of quartz-albite-tourmaline-muscovite that revealed a stage of tourmaline crystallization between two stages of albitization. The textural complex and mineralogical diverse assemblages could now be studied in 3D and offered new insights regarding their crystallography and spatial association of minerals. The observation of Cornish-type cassiterite in greisen pockets confirmed hydrothermal conditions, while the spatial association of columbite-tantalite with oriented zircon textures suggested local magmatic-hydrothermal conditions. This study demonstrates how the combination of an SEM-based AM system with µCT improved our knowledge about the formation history of Nb-Sn-Ta mineralized LCT pegmatites in the KAB.
Acknowledgments
36This article is based on the results obtained by Florian Buyse in the framework of his Ph.D. thesis. Florian Buyse is funded by the European Electron and X-ray Imaging Infrastructure (EXCITE), this project has received funding from the European Union’s Horizon 2020 research and innovation programme under grant agreement No 101005611. SEM instrumentation has received funding from Research Foundation – Flanders (FWO) for medium-scale research infrastructure under grant agreement number I013118N. Dr Florias Mees of the Royal Museum for Central Africa is thanked for the access to the rock collection. We thank Prof. Dr Marieke Van Lichtervelde and Prof. Dr Eric Pirard for their careful review and suggestions that largely improved the manuscript.
Author contribution
37All authors contributed to the conception and design of the study. Material preparation, data collection and analysis were performed by Florian Buyse. Guidance in mineral analysis was performed by Stijn Dewaele. Guidance in µCT acquisition was performed by Matthieu Boone and Veerle Cnudde. The draft of the manuscript was written by Florian Buyse and all authors read and approved the final manuscript.
Data Availability
38The samples of this study are stored in the collection of the Geology department of the UGent. The datasets generated during and/or analyzed during the current study are available from the corresponding author on reasonable request.
References
39Ahn, J.H. & Buseck, P.R., 1998. Transmission electron microscopy of muscovite alteration of tourmaline. American Mineralogist, 83, 535–541. https://doi.org/10.2138/am-1998-5-612
40Aitchison, J., 1982. The statistical analysis of compositional data. Journal of the Royal Statistical Society. Series B (Methodological), 44/2, 139–177. https://doi.org/10.1111/j.2517-6161.1982.tb01195.x
41Ali, S.H., Giurco, D., Arndt, N., Nickless, E., Brown, G., Demetriades, A., Durrheim, R., Enriquez, M.A., Kinnaird, J., Littleboy, A., Meinert, L.D., Oberhänsli, R., Salem, J., Schodde, R., Schneider, G., Vidal, O. & Yakovleva, N., 2017. Mineral supply for sustainable development requires resource governance. Nature, 543, 367–372. https://doi.org/10.1038/nature21359
42Anthony, J.W., Bideaux, R.A., Bladh, K.W. & Nichols M.C. (eds), 2001. Handbook of Mineralogy. Mineralogical Society of America. https://handbookofmineralogy.org/, accessed 08/12/2022.
43Araujo, F.P., Hulsbosch, N. & Muchez, P., 2023. Paragenesis and precipitation stages of Nb-Ta-oxide minerals in phosphorus-rich rare-element pegmatites (Buranga dike, Rwanda). American Mineralogist, 108/2, 277–296. https://doi.org/10.2138/am-2022-8201
44Arganda-Carreras, I., Kaynig, V., Rueden, C., Eliceiri, K.W., Schindelin, J., Cardona, A. & Sebastian Sueng, H., 2017. Trainable Weka Segmentation: a machine learning tool for microscopy pixel classification. Bioinformatics, 33/15, 2424–2426. https://doi.org/10.1093/bioinformatics/btx180
45Baele, J.-M., Bouzahzah, H., Papier, S., Decrée, S., Verheyden, S., Burlet, C., Pirard, E., Franceschi, G. & Dejonghe, L., 2021. Trace-element imaging at macroscopic scale in a Belgian sphalerite-galena ore using Laser-Induced Breakdown Spectroscopy (LIBS). Geologica Belgica, 24/3-4, 125–136. https://doi.org/10.20341/gb.2021.003
46Bam, L.C., Miller, J.A. & Becker, M., 2020. A mineral X-ray linear attenuation coefficient tool (MXLAC) to assess mineralogical differentiation for X-ray computed tomography scanning. Minerals, 10, 441. https://doi.org/10.3390/min10050441
47Baudin, B., Zigirababili, J., Ziserman, A. & Petricec, V., 1982. Carte des gîtes minéraux du Rwanda. 1/250 000. République rwandaise, Ministère des Ressources naturelles, Kigali.
48Boone, M.N., Dewanckele, J., Boone, M., Cnudde, V., Silversmit, G., Van Ranst, E., Jacobs, P., Vincze, L. & Van Hoorebeke, L., 2011. Three-dimensional phase separation and identification in granite. Geosphere, 7/1, 79–86. https://doi.org/10.1130/GES00562.1
49Buyse, F., Dewaele, S., Decrée, S. & Mees, F., 2020. Mineralogical and geochemical study of the rare earth element mineralization at Gakara (Burundi). Ore Geology Reviews, 124, 103659. https://doi.org/10.1016/j.oregeorev.2020.103659
50Buyse, F., Dewaele, S., Boone, M.N. & Cnudde, V., 2023. Combining automated mineralogy with X-ray computed tomography for internal characterization of ore samples at the microscopic scale. Natural Resources Research, 32, 461–478. https://doi.org/10.1007/s11053-023-10161-z
51Cameron, E.N., Jahns, R.H., McNair, A.H. & Page, L.R., 1949. Internal Structure of Granitic Pegmatites. Economic Geology Monograph, 2, 115 p. https://doi.org/10.5382/Mono.02
52Černy, P., 1991. Rare-element granitic pegmatites. Part I: Anatomy and internal evolution of pegmatite deposits. Geoscience Canada, 18/2, 49–67.
53Černy, P. & Ercit, T.S., 2005. The classification of granitic pegmatites revisited. The Canadian Mineralogist, 43, 2005–2026. https://doi.org/10.2113/gscanmin.43.6.2005
54Cnudde, V. & Boone, M.N., 2013. High-resolution X-ray computed tomography in geosciences: A review of the current technology and applications. Earth-Science Reviews, 123, 1–17. https://doi.org/10.1016/j.earscirev.2013.04.003
55Craig, J.R. & Vaughan, D.J., 1994. Ore Microscopy and Ore Petrography. 2nd ed. John Wiley and Sons, New York, 434 p.
56Cuff, C. & Taylor, R.G., 1979. The mineralogy and aspects of the crystal chemistry of tin. In Taylor, R.G. (ed.), Geology of Tin Deposits. , Elsevier, Amsterdam, 321–467. https://doi.org/10.1016/B978-0-444-41805-0.50013-X
57Daltry, V.D.C. & von Knorring, O., 1998. Type-mineralogy of Rwanda with particular reference to the Buranga pegmatite. Geologica Belgica, 1, 9–15. https://doi.org/10.20341/gb.2014.002
58Debruyne, D., Hulsbosch, N., Van Wilderode, J., Balcaen, L., Vanhaecke, F. & Muchez, P., 2015. Regional geodynamic context for the Mesoproterozoic Kibara Belt (KIB) and the Karagwe-Ankole Belt: Evidence from geochemistry and isotopes in the KIB. Precambrian Research, 264, 82–97. https://doi.org/10.1016/j.precamres.2015.04.001
59De Clercq, F., 2012. Metallogenesis of Sn and W vein-type deposits in the Karagwe-Ankole belt (Rwanda). Unpublished Ph.D. Thesis, KU Leuven, Leuven, 270 p. https://lirias.kuleuven.be/retrieve/198299, accessed 24/04/2023.
60De Clercq, S., Chew, D., O’Sullivan, G., De Putter, T., De Grave, J. & Dewaele, S., 2021. Characterisation and geodynamic setting of the 1 Ga granitoids of the Karagwe-Ankole belt (KAB), Rwanda. Precambrian Research, 356, 106124. https://doi.org/10.1016/j.precamres.2021.106124
61Dewaele, S., Henjes-Kunst, F., Melcher, F., Sitnikova, M., Burgess, R., Gerdes, A., Fernandez-Alonso, M., De Clercq, F., Muchez, P. & Lehmann, B., 2011. Late Neoproterozoic overprinting of the cassiterite and columbite-tantalite bearing pegmatites of the Gatumba area, Rwanda (Central Africa). Journal of African Earth Sciences, 61/1, 10–26. https://doi.org/10.1016/j.jafrearsci.2011.04.004
62Dewaele, S., Goethals, H. & Thys, T., 2013. Mineralogical characterization of cassiterite concentrates from quartz vein and pegmatite mineralization of the Karagwe-Ankole and Kibara Belts, Central Africa. Geologica Belgica, 16/1-2, 66–75.
63Dewaele, S., De Clercq, F., Hulsbosch, N., Piessens, K., Boyce, A. & Burgess, R., 2016. Genesis of the vein-type tungsten mineralization at Nyakabingo (Rwanda) in the Karagwe–Ankole belt, Central Africa. Mineralium Deposita, 51, 283–307. https://doi.org/10.1007/s00126-015-0608-x
64Dhaene, J., Pauwels, E., De Schryver, T., De Muynck, A., Dierick, M. & Van Hoorebeke, L., 2015. A realistic projection simulator for laboratory based X-ray micro-CT. Nuclear Instruments and Methods in Physics Research B, 342, 170–178. https://doi.org/10.1016/j.nimb.2014.09.033
65Dill, H.G., 2010. The “chessboard” classification scheme of mineral deposits: Mineralogy and geology from aluminum to zirconium. Earth-Science Reviews, 100/1-4, 1–420. https://doi.org/10.1016/j.earscirev.2009.10.011
66Dill, H.G., 2015. Pegmatites and aplites: Their genetic and applied ore geology. Ore Geology Reviews, 69, 417–561. https://doi.org/10.1016/j.oregeorev.2015.02.022
67Dill, H.G., Weber, B. & Botz, R., 2011. The baryte-bearing beryl-phosphate pegmatite Plössberg – A missing link between pegmatitic and vein-type barium mineralization in NE Bavaria, Germany. Chemie der Erde, 71, 377–387. https://doi.org/10.1016/j.chemer.2011.07.001
68Fernandez-Alonso, M., Cutten, H., De Waele, B., Tack, L., Tahon, A., Baudet, D. & Baritt, S.D., 2012. The Mesoproterozoic Karagwe-Ankole Belt (formerly the NE Kibara Belt): The result of prolonged extensional intracratonic basin development punctuated by two short-lived far-field compressional events. Precambrian Research, 216-219, 63–86. https://doi.org/10.1016/j.precamres.2012.06.007
69Fuchsloch, W.C., Nex, P.A. & Kinnaird, J.A., 2019. The geochemical evolution of Nb-Ta-Sn oxides from pegmatites of the Cape Cross-Uis pegmatite belt, Namibia. Mineralogical Magazine, 83, 161–179. https://doi.org/10.1180/mgm.2018.151
70Godel, B., 2013. High-resolution X-ray computed tomography and its application to ore deposits: From data acquisition to quantitative three-dimensional measurements with case studies from Ni-Cu-PGE deposits. Economic Geology, 108/8, 2005–2019. https://doi.org/10.2113/econgeo.108.8.2005
71Guntoro, P.I., Ghorbani, Y., Butcher, A.R., Kuva, J. & Rosenkranz, J., 2020. Textural quantification and classification of drill cores for geometallurgy: Moving toward 3D with X-ray microcomputed tomography (µCT). Natural Resources Research, 29, 3547–3565. https://doi.org/10.1007/s11053-020-09685-5
72Herrington, R., 2021. Mining our green future. Nature Reviews Materials, 6, 456–458. https://doi.org/10.1038/s41578-021-00325-9
73Hrstka, T., Gottlieb, P., Skála, R., Breiter, K. & Motl, D., 2018. Automated mineralogy and petrology—Applications of TESCAN Integrated Mineral Analyzer (TIMA). Journal of Geosciences, 63, 47–63. https://doi.org/10.3190/jgeosci.250
74Hulsbosch, N., 2019. Nb-Ta-Sn-W distribution in granite-related ore systems: Fractionation mechanisms and examples from the Karagwe-Ankole Belt of Central Africa. In Decrée, S. & Robb, L. (eds) Ore Deposits: Origin, Exploration, and Exploitation. American Geophysical Union, Washington, and John Wiley & Sons, Hoboken, N.J., Geophysical Monograph Series, 242, 75–107. https://doi.org/10.1002/9781119290544.ch4
75Hulsbosch, N. & Muchez, P., 2020. Tracing fluid saturation during pegmatite differentiation by studying the fluid inclusion evolution and multiphase cassiterite mineralisation of the Gatumba pegmatite dyke system (NW Rwanda). Lithos, 354-355, 105285. https://doi.org/10.1016/j.lithos.2019.105285
76Hulsbosch, N., Hertogen, J., Dewaele, S., André, L. & Muchez, P., 2013. Petrographic and mineralogical characterisation of fractionated pegmatites culminating in the Nb-Ta-Sn pegmatites of the Gatumba area (western Rwanda). Geological Belgica, 16/1-2, 105–117.
77Hulsbosch., N., Hertogen, J., Dewaele, S., André, L. & Muchez, P., 2014. Alkali metal and rare earth element evolution of rock-forming minerals from the Gatumba area pegmatites (Rwanda): Quantitative assessment of crystal-melt fractionation in the regional zonation of pegmatite groups. Geochimica et Cosmochimica Acta, 132/1, 349–374. https://doi.org/10.1016/j.gca.2014.02.006
78Jahns, R.H., 1953. The genesis of pegmatites I. Occurrence and origin of giant crystals. American Mineralogist, 38/7-8, 563–598.
79Jahns, R.H. & Burnham, C.W., 1969. Experimental studies of pegmatite genesis: I. A model for the derivation and crystallization of granitic pegmatites. Economic Geology, 64/8, 843–864. https://doi.org/10.2113/gsecongeo.64.8.843
80Jardine, M.A., Miller, J.A. & Becker, M., 2018. Coupled X-ray computed tomography and grey level co-occurrence matrices as a method for quantification of mineralogy and texture in 3D. Computers and Geosciences, 111, 105–117. https://doi.org/10.1016/j.cageo.2017.11.005
81Kaeter, D., Barros, R., Menuge, J.F. & Chew, D.M., 2018. The magmatic-hydrothermal transition in rare-element pegmatites from southeast Ireland: LA-ICP-MS chemical mapping of muscovite and columbite-tantalite. Geochimica et Cosmochimica Acta, 240, 98–130. https://doi.org/10.1016/j.gca.2018.08.024
82Kaeter, D., Barros, R. & Menuge, J.F., 2021. Metasomatic high fields strength element, tin and base metal enrichment processes in lithium pegmatites from Southeast Ireland. Economic Geology, 116/1, 169–198. https://doi.org/10.5382/econgeo.4784
83Kyle, J.R. & Ketcham, R.A., 2015. Application of high resolution X-ray computed tomography to mineral deposit origin, evaluation, and processing. Ore Geology Reviews, 65, 821–839. https://doi.org/10.1016/j.oregeorev.2014.09.034
84Laforce, B., Vermeulen, B., Garrevoet, J., Vekemans, B., Van Hoorebeke, L., Janssen, C. & Vincze, L., 2016. Laboratory scale X-ray fluorescence tomography: Instrument characterization and application in earth and environmental science. Analytical Chemistry, 88/6, 3386–3391. https://doi.org/10.1021/acs.analchem.6b00137
85Lehmann, B., Melcher, F., Sitnikova, M.A. & Ruzindana Munana, J., 2008. The Gatumba rare-metal pegmatites: chemical signature and environmental impact. Etudes rwandaises, 16, 25–40.
86Lehmann, B., Halder, S., Ruzindana Munana, J., de la Paix Ngizimana, J. & Biryabarema, M., 2014. The geochemical signature of rare-metal pegmatites in Central Africa: Magmatic rocks in the Gatumba tin-tantalum mining district, Rwanda. Journal of Geochemical Exploration, 144, 528–538. https://doi.org/10.1016/j.gexplo.2013.11.012
87Leichmann, J., Jacher-Sliwczynska, K. & Broska, I., 2009. Element mobility and fluid path ways during feldspar alteration: textural evidence from cathodoluminescence and electron microprobe study of an example from tonalites (High Tatra, Polan-Slowakia). Neues Jahrbuch für Mineralogie – Abhandlungen, 186/1, 1–10. https://doi.org/10.1127/0077-7757/2009/0124
88Lindgren, W., 1937. Succession of minerals and temperatures of formation in ore deposits of magmatic affiliations. American Institute of Mining, Metallurgical, and Petroleum Engineers, Technical Publication, 126, 23 p.
89Linnen, R.L., Van Lichtervelde, M. & Černy, P., 2012. Granitic pegmatites as sources of strategic metals. Elements, 8/4, 275–280. https://doi.org/10.2113/gselements.8.4.275
90Lobos, R., Silva, J.F., Ortiz, J.M., Díaz, G. & Egaña, A., 2016. Analysis and classification of natural rock textures based on new transform-based features. Mathematical Geosciences, 48, 835–870. https://doi.org/10.1007/s11004-016-9648-8
91London, D., 2008. Pegmatites. Mineralogical Association of Canada, Québec, The Canadian Mineralogist Special Publications, 10, 347 p.
92London, D., 2018. Ore-forming processes within granitic pegmatites. Ore Geology Reviews, 101, 349–383. https://doi.org/10.1016/j.oregeorev.2018.04.020
93London, D. & Morgan, G.B., 2017. Experimental crystallization of the Macusani obsidian, with applications to lithium-rich granitic pegmatites. Journal of Petrology, 58/5, 1005–1030. https://doi.org/10.1093/petrology/egx044
94Lubbers, J., Kent, A., Meisenheimer, D. & Wildenschild, D., 2023. 3D zoning of barium in alkali feldspar. American Mineralogist, 108, 297–311. https://doi.org/10.2138/am-2022-8139
95Maravic, H.v., Morteani, G. & Roethe G., 1989. The cancrinite-syenite/carbonatite complex of Lueshe, Kivu/NE-Zaire: petrographic and geochemical studies and its economic significance. Journal of African Earth Sciences, 9/2, 341–355. https://doi.org/10.1016/0899-5362(89)90077-8
96Masschaele, B., Dierick, M., Van Loo, D., Boone, M.N., Brabant, L., Pauwels, E., Cnudde, V. & Van Hoorebeke, L., 2013. HECTOR: A 240kV micro-CT setup optimized for research. Journal of Physics: Conference Series, 463, 012012. https://doi.org/10.1088/1742-6596/463/1/012012
97McNeil, A.G., Linnen, R.L., Flemming, R.L. & Fayek, M., 2020. An experimental approach to examine fluid-melt interaction and mineralization in rare-metal pegmatites. American Mineralogist, 105/7, 1078–1087. https://doi.org/10.2138/am-2020-7216
98Melcher, F., Graupner, T., Gäbler, H.-E., Sitnikova, M., Henjes-Kunst, F., Oberthür, T., Gerdes, A. & Dewaele, S., 2015. Tantalum–(niobium–tin) mineralisation in African pegmatites and rare metal granites: Constraints from Ta–Nb oxide mineralogy, geochemistry and U–Pb geochronology. Ore Geology Reviews, 64, 667–719. https://doi.org/10.1016/j.oregeorev.2013.09.003
99Mills, S.J., Birch, W.D., Kampf, A.R. & Van Wambeke, L., 2010. Kobokoboite, Al6(PO4)4(OH)6.11H2O, a new mineral from the Kobokobo pegmatite, Democratic Republic of the Congo. European Journal of Mineralogy, 22/2, 305–308. https://doi.org/10.1127/0935-1221/2010/0022-2014
100Pankhurst, M. J., Gueninchault, N., Andrews, M. & Hill, E., 2019. Non-destructive three-dimensional crystallographic orientation analysis of olivine using laboratory diffraction contrast tomography. Mineralogical Magazine, 83/5, 705–711. https://doi.org/10.1180/mgm.2019.51
101Pohl, W.L., Biryabarema, M. & Lehmann, B., 2013. Early Neoproterozoic rare metal (Sn, Ta, W) and gold metallogeny of the Central Africa Region: a review. Applied Earth Science, 122/2, 66–82. https://doi.org/10.1179/1743275813Y.0000000033
102Reyes, F., Lin, Q., Udoudo, O., Dodds, C., Lee, P.D. & Neethling, S.J., 2017. Calibrated X-ray micro-tomography for mineral ore quantification. Minerals Engineering, 110, 122–130. https://doi.org/10.1016/j.mineng.2017.04.015
103Safiannikoff, A. & Van Wambeke, L., 1967. La pegmatite radioactive à béryl de Kobokobo et les autres venues pegmatitiques et filoniennes de la région de Kamituga – Kivu – Rép. du Congo. Mineralium Deposita, 2, 119–130. https://doi.org/10.1007/BF00206584
104Sahagian, D.L. & Proussevitch, A.A., 1998. 3D particle size distributions from 2D observations: stereology for natural applications. Journal of Volcanology and Geothermal Research, 84, 173–196. https://doi.org/10.1016/S0377-0273(98)00043-2
105Schindelin, J., Arganda Carreras, I., Frise, E., Kaynig, V., Longair, M., Pietzsch, T., Preibisch, S., Rueden, C., Saalfeld, S., Schmid, B., Tinevez, J.-Y., White, D.J., Hartenstein, V., Eliceiri, K., Tomancak, P. & Cardona, A., 2012. Fiji: an open-source platform for biological-image analysis. Nature Methods, 9, 676–682. https://doi.org/doi:10.1038/nmeth.2019
106Simmons, W.B.S. & Webber, K.L. 2008. Pegmatite genesis: state of the art. European Journal of Mineralogy, 20/4, 421–438. https://doi.org/10.1127/0935-1221/2008/0020-1833
107Sittner, J., Brovchenko, V., Siddique, A., Buyse, F., Boone, M., Renno, A.D., Cnudde, V., Merkulova, M. & Sluzhenikin, S.F., 2022. Three-dimensional distribution of platinum group minerals in natural MSS-ISS ores from the Norilsk One deposit, Russia. Frontiers in Earth Science, 10, 860751. https://doi.org/10.3389/feart.2022.860751
108Tack, L., Wingate, M.T.D., De Waele, B., Meert, J., Belousova, E., Griffin, B., Tahon, A. & Fernandez-Alonso, M., 2010. The 1375 Ma “Kibaran event” in Central Africa: Prominent emplacement of bimodal magmatism under extensional regime. Precambrian Research, 180, 63–84. https://doi.org/10.1016/j.precamres.2010.02.022
109Turimumahoro, D., Hulsbosch, N., Nahimana, L., Dewaele, S. & Muchez, P. 2020. Géochimie des muscovites comme indicateur du fractionnement des pegmatites de la région de Kabarore-Mparamirundi (nord-ouest du Burundi, Afrique centrale). Geologica Belgica, 23/1-2, 53–67. https://doi.org/10.20341/gb.2020.005
110Van Daele, J., Jacques, D., Hulsbosch, N., Dewaele, S. & Muchez, P., 2021. Integrative structural study of the Kibuye-Gitarama-Gatumba area (West Rwanda): A contribution to reconstruct the Meso- and Neoproterozoic tectonic framework of the Karagwe-Ankole Belt. Precambrian Research, 353, 106009. https://doi.org/10.1016/j.precamres.2020.106009
111Van Lichtervelde, M., Salvi, S., Beziat, D. & Linnen, R.L., 2007. Textural features and chemical evolution in tantalum oxides: Magmatic versus hydrothermal origins for Ta mineralization in the Tanco Lower pegmatite, Manitoba, Canada. Economic Geology, 102, 257–276. https://doi.org/10.2113/gsecongeo.102.2.257
112Van Lichtervelde, M., Grégoire, M., Linnen, R.L., Béziat, D. & Salvi, S., 2008. Trace element geochemistry by laser ablation ICP-MS of micas associated with Ta mineralization in the Tanco pegmatite, Manitoba, Canada. Contributions to Mineralogy and Petrology, 155, 791–806. https://doi.org/10.1007/s00410-007-0271-z
113Van Lichtervelde, M., Melcher, F. & Wirth R., 2009. Magmatic vs. hydrothermal origins for zircon associated with tantalum mineralization in the Tanco pegmatite, Manitoba, Canada. American Mineralogist, 94, 439–450. https://doi.org/10.2138/am.2009.2952
114Varlamoff, N., 1972. Central and West African rare-metal granitic pegmatites, related aplites, quartz veins and mineral deposits. Mineralium Deposita, 7/2, 202–216. https://doi.org/10.1007/BF00207155
115Varlamoff, N., 1975. Classification des gisements d’étain. Académie royale des Sciences d’Outre-Mer, Classe des Sciences naturelles et médicales, N.S., 19/5, 63 p.
116Vdovina, I., 2019. Crystallomorphology of cassiterite and its practical importance. In Glagolev, S. (ed.), 14th International Congress for Applied Mineralogy (ICAM2019). Springer, Cham, 157–161. https://doi.org/10.1007/978-3-030-22974-0_37
117Vlasov, K.A., 1961. Principles of classifying granite pegmatites and their textural-paragenetic types. Transactions of the Academy of Sciences, U.S.S.R., Geologic Series, 1, 5–20.
118Vlassenbroeck, J., Dierick, M., Masschaele, B., Cnudde, V., Van Hoorebeke, L. & Jacobs, P., 2007. Software tools for quantification of X-ray microtomography at the UGCT. Nuclear Instruments and Methods in Physics Research A, 580/1, 442–445. https://doi.org/10.1016/j.nima.2007.05.073
119Warlo, M., Bark, G., Wanhainen, C., Butcher, A.R., Forsberg, F., Lycksam, H. & Kuva, J., 2021. Multi-scale X-ray computed tomography analysis to aid automated mineralogy in ore geology research. Frontiers in Earth Science, 9, 789372. https://doi.org/10.3389/feart.2021.789372
120Withers, P.J., Bouman, C., Carmignato, S., Cnudde, V., Grimaldi, D., Hagen, C.K., Maire E., Manley, M., Du Plessis, A. & Stock, S.R., 2021. X-ray computed tomography. Nature Reviews Methods Primers, 1, 18. https://doi.org/10.1038/s43586-021-00015-4
121Manuscript received 26.09.2023, accepted in revised form 08.12.2023, available online 17.01.2024.