


- Accueil
- Volume 17 (2013)
- numéro 1
- The relevance of food composition data for nutrition surveys in rural Tibet: pilot study in the context of Kashin-Beck Disease


Visualisation(s): 5707 (35 ULiège)
Téléchargement(s): 94 (1 ULiège)

The relevance of food composition data for nutrition surveys in rural Tibet: pilot study in the context of Kashin-Beck Disease

Notes de la rédaction
Received on December 5, 2011; accepted on October 11, 2012
Résumé
La pertinence des données de composition des aliments pour les enquêtes nutritionnelles dans les régions rurales du Tibet : étude pilote dans le cadre de la maladie de Kashin-Beck. La maladie de Kashin-Beck se traduit par une ostéochondropathie endémique et chronique. Cette maladie se rencontre principalement dans la Région Autonome du Tibet et dans plusieurs provinces de la République Populaire de Chine. Bien que toujours incertaine, l’étiologie de cette maladie est vraisemblablement environnementale et multifactorielle, et l’apport en minéraux est supposé y jouer un rôle prépondérant. L’alimentation en particulier différencie les populations rurales touchées par la maladie des autres groupes (nomades et citadins). L’objectif de la présente étude, préliminaire à une enquête nutritionnelle épidémiologique, est l’analyse de la composition minérale (Ca, P, Mg, Fe, Zn, Mn, Cu, Ni, Se, Al, Sr, Mo, Cd, As, Pb, Hg, Cr et Co) de huit aliments de base au Tibet et la comparaison des résultats avec deux tables de composition alimentaires. Vingt familles furent recrutées dans des régions rurales endémiques et non endémiques aux alentours de Lhassa, et les aliments y ont été échantillonnés. Une dizaine de minéraux impliqués dans le métabolisme osseux a été analysée par diverses méthodes spectrométriques atomiques et moléculaires. Les résultats semblent indiquer qu’un nombre très limité de couples aliments/constituants présente une variation de la composition minérale au cours d’une même année pour une région donnée. Par contre, il y a des différences significatives entre les régions endémiques et non endémiques, surtout pour la farine de blé. Les contenus en minéraux des aliments tibétains ont ensuite été comparés à la composition d’aliments similaires provenant de tables de composition alimentaire : USDA National Nutrient Database (USDA Food Search for Windows, Version 1.0, database version SR23) et China Food Composition (livre 1, 2e édition). Plus de 50 à 60 % des p-valeurs sont inférieures à 0,05, suggérant l’inadéquation des tables de composition alimentaire dans le cas d’étude nutritionnelle en région rurale tibétaine et l’importance de l’analyse des aliments traditionnels. Les différences sont plus marquées en fonction des éléments considérés et les teneurs en calcium semblent les plus éloignées des tables. Le nombre d’échantillons par aliments et surtout le nombre d’aliments échantillonnés sont trop faibles pour tirer des conclusions définitives. Cependant, il semble que la présente étude pilote indique des divergences significatives entre les valeurs mesurées et les valeurs des tables. Une étude plus complète est donc indispensable.
Abstract
Kashin-Beck disease (KBD) is an endemic and chronic osteochondropathy. This disease principally occurs in the Tibet Autonomous Region and in several provinces of the People's Republic of China. The etiology of the disease remains obscure although environmental factors are assumed to be involved. Diet, in particular, differentiates the rural community, affected by KBD, from the other communities (nomads and city-dwellers), who remain unaffected. In anticipation of a nutrition survey, this study aimed to measure the mineral content (Ca, P, Mg, Fe, Zn, Mn, Cu, Ni, Se, Al, Sr, Mo, Cd, As, Pb, Hg, Cr, and Co) of eight Tibetan staple foods and to compare the results against two food composition tables (FCTs). Foods were sampled in twenty households selected from both an endemic and a non-endemic area of rural Tibet. Ten minerals involved in bone metabolism were measured using atomic and molecular spectrometric methods. Results revealed that a very limited number of food/constituent pairs showed a variation in mineral composition during a single year of testing for a given region. In addition, results showed significant differences in mineral content between the endemic and the non-endemic area, especially for wheat flour. Following our analysis of the mineral content of the Tibetan food samples, results were statistically compared with similar foods listed in two food composition tables: the USDA National Nutrient Database (USDA Food Search for Windows, Version 1.0, database version SR23), and the China Food Composition Table (book 1, 2nd edition). More than 50 to 60% of p-values < 0.05 were highlighted, suggesting the inappropriateness of using FCTs as a reference for nutrition surveys in rural Tibet, and emphasizing the need for analysis of traditional foods. Differences were found to be more or less marked depending on the element considered, and calcium content seemed to show the greatest difference. Although it is obviously too early for definite conclusions to be reached (insufficient number of samples by food and insufficient number of foods analyzed), it seems that the present pilot-study indicates significant discrepancies between measured and tabulated values of the mineral content of certain foods. A more complete survey would therefore seem mandatory.
Table des matières
1. Introduction
1Today, Kashin-Beck disease (KBD) principally occurs in the Tibet Autonomous Region and in several western provinces of the People’s Republic of China. It is estimated that KBD affects between 0.74 million and 2.5 million people in China and other parts of Asia; between 10 and 30 million people are estimated to be at risk (Yamamuro, 2001; Mathieu et al., 2008a; Wang et al., 2008; Wang et al., 2009). KBD is an endemic and chronic osteochondropathy characterized by short stature and skeletal deformities, especially of the long bones and joints. Joints become enlarged, stiff and painful. Mobility of limbs becomes limited and consequently muscles can become atrophied. Symptoms appear during childhood and may worsen progressively. The pathophysiological feature of KBD is a focal chondronecrosis of mature chondrocytes in the deep zone of the growth plate cartilage and the articular cartilage (Mathieu et al., 2008a; Wang et al., 2008; Wang et al., 2009).
2Although many studies have been conducted and many others are still underway, the etiology of the disease remains unknown. Nevertheless, a multifactorial hypothesis has been proposed: a combination of selenium and iodine deficiency, high concentrations of organic matter in drinking water (fulvic acids), and mycotoxin poisoning via fungal infection of cereals (Yang et al., 1993; Moreno-Reyes et al., 1998; Haubruge et al., 2001; Suetens et al., 2001; Mathieu et al., 2008a; Mathieu et al., 2008b; Li et al., 2009; Shi et al., 2009).
3According to several authors (Haubruge et al., 2000; Malaisse et al., 2008), Tibetan populations share four macro-ecosystems: the urban zone; the suburban zone, which is mechanized and has access to communication media; the agricultural zone, relying on subsistence farming; the pastoral zone located at over 4,500 m in altitude and featuring nomads and yaks. KBD is only encountered in the agricultural zone and endemic areas are limited to poor, isolated and rural communities. Diet is a major factor differentiating these four groups. In addition, an unpublished study by de Voghel et al. (2008) highlighted the poorly diversified diet of those living in endemic areas and the probable deficiencies of several nutrients involved in bone metabolism.
4In anticipation of a nutrition survey in the region, one of the objectives of this study aimed to measure the mineral content of the main staple foods of Tibetan peasants living in an endemic area (EA). Generally, nutrition studies are based on food composition tables (FCTs) (Gibson, 1990; Church, 2006; Egan et al., 2009). The USDA National Nutrient Database for Standard Reference (US Department of Agriculture, 2010) and The China Food Composition Table (National Institute of Nutrition and Food Safety China CDC, 2009) were selected for this study. Nevertheless, the composition of foods as listed in national FTCs may be quite different from the composition of foods in a given local area. Another of our objectives was to ensure that the results of the food analyses carried out in the present study matched with the reference values of FCTs. We wanted to be certain that a Tibetan nutrition survey based on FCTs would not introduce a major bias into the estimation of daily intake, as sometimes occurs (Moon et al., 1996). With this in mind, the mean mineral content of Tibetan food samples was statistically compared to the reference values of similar foods listed in the two selected FCTs. The aim was to determine the most appropriate FCT to use as a reference. Given the symptoms of KBD, this study focused on several minerals involved directly or indirectly in bone metabolism: Ca, P, Mg, Fe, Zn, Mn, Cu, Ni, Se, Al, Sr, Mo, Cd and As (Matsumoto et al., 1991; Sctrick, 1991; Jacotot et al., 1992; Martin, 2000; Sarazin et al., 2000; Moreno-Reyes et al., 2001; Baron et al., 2002; Pi et al., 2004; Marieb, 2005). A third objective of our study was to make a comparison of mean food mineral content between an endemic and a non-endemic rural area in Tibet. Screening for heavy metals was also undertaken (Pb, Hg, Cr, Co).
2. Materials and methods
2.1. Study area and sampling
5Ten households from Nimo and Lhundrop counties (high KBD prevalence areas near Lhasa) were enrolled into the study. They were selected from the Kashin-Beck Disease Fund database according to two criteria: presence in the family of a 3 to 5 year old child (at this age, children are weaned and eat home cooking) and of an older KBD-affected child. Children with an affected sibling are more likely to develop the disease (Suetens et al., 2001). The application of these criteria is especially important for the ongoing nutrition survey. Ten additional households were enrolled in Rinpung, a non-endemic area. These also included a young child.
6Food sampling was carried out twice in the endemic area, in winter (February 2010 = EAw) and in spring (May 2010 = EAs), in order to assess variance caused by a possible seasonal effect. One sampling campaign was also carried out in the non-endemic area (July 2011= NEA). Staple foods, which were selected based on the findings of a previous nutrition survey (Goyens et al., 2008), were collected from each family. The foods were: roasted barley flour, wheat flour, black tea, rice, potatoes, Chinese radish and yak butter. Samples of raw foods were taken from the top of their respective containers in order to get closer to the conditions of consumption. The container itself was not suspected of being the cause of heterogeneity in the mineral content of the samples taken. Samples were collected in single-use “food quality” plastic bags and stored in a place safe from humidity. Sometimes, one or several foods were unavailable in some households during the sampling period. The eighth staple food to be analyzed, Chinese cabbage, was bought in Lhasa. This food, frequently consumed, is not grown at home and families buy it in Lhasa. The day after sampling, in order to avoid contamination and deterioration, potatoes and Chinese cabbages were cut and dried at 105 °C in an air oven until an unchanging dry weight was obtained, enabling determination of dry matter (DM) content and long-term storage.
2.2. Reagents and glassware
7The laboratory glassware used was cleaned by soaking overnight in a 6N nitric acid bath and rinsed at least four times with distilled water. All reagents were of analytical grade. Ultrapure water was used throughout the analyses.
2.3. Sample digestion
8The sampling portion was about one gram, weighed with an analytical balance (AE 200 Mettler) in a Teflon container and placed in an HPR 1000/6 rotor. Six milliliters of 65% nitric acid (AnalR Normapur, VWR Prolabo) and 1 ml of 35% hydrogen peroxide (analytical reagent, Merck) were added. Samples were then submitted to microwave assisted mineralization in a high performance microwave digestion unit, MLS 1200 mega (Milestone, Brøndby, Denmark) with an MLS Mega 240 terminal and EM 45 A exhaust module. The following optimized microwave program was implemented: 250 W: 2 min; 0 W: 2 min; 250 W: 6 min; 400 W: 5 min; 600 W: 5 min; ventilation: 10 min. The program used was based on the manufacturer’s recommendations for use (Milestone Cookbook of Microwave Application Notes for MDR technology, January 1995). The rotor was then cooled down for a period of 1 h. Mineralized solutions were quantitatively transferred into 50 ml volumetric flasks and diluted to volume with ultrapure water. Teflon containers were rinsed at least 3 times with ultrapure water. Black tea was brewed in the traditional Tibetan way (R. Wangla, personal communication): approximately 10 g of tea were weighed precisely and then boiled in 100 ml of ultrapure water for 1 h 30. Infusions were then filtered through folded filter papers (MN 616 1/4 18.5 cm diameter; Macherey-Nagel, Düren, Germany) and diluted to 250 ml with ultrapure water. Twenty ml samples of this solution were transferred with a volumetric pipette into a Teflon container and were directly mineralized under the aforementioned conditions.
2.4. Atomic absorption spectroscopy procedures
9Most of the mineral elements were measured using atomic absorption spectroscopy (Ca, Mg, Fe, Zn, Mn, Cu, Ni, Se, Al, Sr, Mo, Cd, As, Pb, Hg, Cr et Co, by flame atomic absorption spectrometry [FAAS], electrothermal atomic absorption spectrometry [ETAAS], hydride generation and cold vapor generation) in Belgium (Bureau Environnement et Analyses de Gembloux, BEAGx). Phosphorus was measured using UV-Vis spectrophotometry at 700 nm on a UV-1205 Shimadzu (Shimadzu, Kyoto, Japan) with an Epson LX-300 printer, using the Scheele method (heptamolybdate reagent). Most selenium levels were found to be below the limit of quantification (LOQ). Results were therefore confirmed by inductively coupled plasma atomic emission spectroscopy (ICP-AES) on several samples at the Walloon Agricultural Research Centre (CRA-W), Agricultural Product Technology Unit.
10A PerkinElmer 1100 B flame atomic absorption spectrometer (PerkinElmer, Waltham, USA) was used for Ca, Mg, Zn, Fe, Mn, Cu, Ni, Al, Sr, and Mo analyses. Dilutions with spectral buffer LaCl3 2 g·l-1 in HNO3 2% were performed for Ca, Mg, Al and Mo. When dilutions were required for other elements, a solution of HNO3 2% in ultrapure water was used. Dilutions were performed with a Microlab® 500 series diluter (Hamilton Company, Bonaduz, GR, Switzerland). A background correction method using a deuterium lamp was applied to all the minerals tested except for calcium. Cu, Ni, Cd, Pb, Cr and Co analyses were performed with a PerkinElmer AAnalyst 800™ electrothermal atomic absorption spectrometer (PerkinElmer, Waltham, USA) with P-E AS 800 autosampler. A matrix modifier (Bernd Kraft GmbH, Duisburg Germany) (Pd+Mg/HNO3 2 M) was used. Background correction based on the Zeeman Effect was also applied. In both devices, the light source was provided by hollow cathode P-E lumina lamps. Arsenic and selenium were measured using the hydride generation method (HG). Two milliliters of a solution of 5% KI (Fisher) and 5% ascorbic acid (Acros Organics) and 1 ml of 37% HCl (analytical reagent, Merck) were added to 2 ml of mineralized solutions. No KI was added for Se analysis. The whole solution was homogenized and allowed to reduce for a period of 45 min before dilution to 10 ml with ultrapure water. Samples were analyzed using a PerkinElmer AAnalyst 800™ equipped with a quartz cell and with a P-E As 90plus autosampler. The reagent solutions used for hydride generation were HCl 10% and NaBH4 0.5% (for As) and 0.02% (for Se) and NaOH 0.005%. Mercury was analyzed using cold vapor generation (Co.Vap.) on a P-E FIMS-400 equipped with a S10 autosampler. A 5 ml sample portion was taken from each solution. Calibration curves were obtained with multi-element standard solutions (Bernd Kraft GmbH), except in the case of phosphorus and strontium, for which KH2PO4 and Sr(NO3)2 solutions (Merck) were used.
2.5. Statistical methodology
11Statistical analyses were performed with the Minitab 15.1 software. Parametric tests were performed after checking the conditions of application (homoscedasticity and normality of the populations). Otherwise, transformations of variables were tested using the Box-Cox method. As a last resort, nonparametric tests were applied. In cases where no significant difference was found between the mineral composition of the analyzed food samples, the Tukey Significant Difference method was used for the classification of statistical means.
12The mineral composition of the analyzed foods was then compared against two FCTs. The China Food Composition Table (book 1, 2nd edition) was chosen because it is probably the most appropriate for nutritional survey for the Tibet Autonomous Region. A comparison with the USDA National Nutrient Database was also made because it represents one of the most comprehensive FCTs in terms of number of food types listed and number of samples per food tested.
2.6. Quality control
13The methods used (mineralization and measurements) were validated via certified reference materials (CRMs). Two CRMs: White cabbage BCR®-679 and Wheat flour ERM®-BC382, were obtained from the European Institute for Reference Materials and Measurements (Geel, Belgium). These CRMs were selected because they include almost all the elements of interest and because of their similarity with our sample matrices. However, these CRMs do not include a certified value for selenium. The CRMs were processed and analyzed here following the same procedures as for the samples. Measurement of each element was performed as described above in at least four replicates. Dry matter content was determined according to the provider’s instructions. Statistical comparison between measurement results and certified values was also made according to the provider’s instructions (Linsinger, 2005). Besides the validation by CRMs (through demonstration of recovery and repeatability), supplementary parameters were also assessed, such as limits of quantification (LOQs), linearity ranges, calibration curves and repeatability on samples.
3. Results and discussion
3.1. Validation of methods
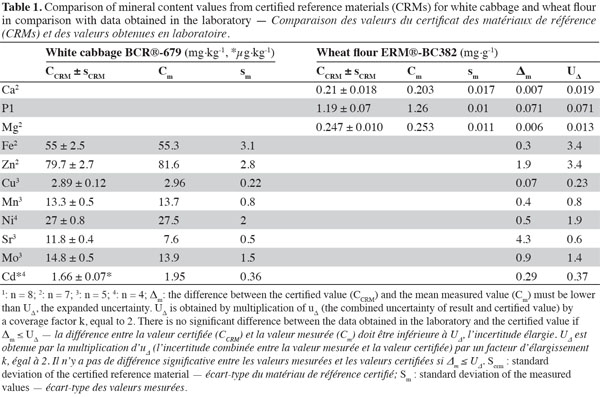
14Data were expressed in mg·kg-1 of dry matter. Results of measurements were compared with the certified values following an appropriate procedure (Linsinger, 2005). Table 1 shows the mineral content values from the CRMs for white cabbage and wheat flour in comparison with data obtained in the laboratory. As Δm, the difference between the certified value (CCRM) and the mean measured value (Cm), must be lower than UΔ, the expanded uncertainty, the analytical method was validated for the following elements: Ca, P, Mg, Fe, Zn, Mn, Cu, Ni, Mo and Cd but not for Sr. Se, As, Pb, Hg, Cr, Co and Al content was not certified in the reference materials.
15Relative standard deviations (RSDs) were calculated on five replicates of CRM, and five replicates of one barley flour sample. No RSD exceeded 10% and most were below 5%. Linearity ranges were defined by the interval between the LOQs and the upper limit of the calibration curves. All determination coefficients (R²) of the calibration curves were higher than 0.998. LOQs were calculated for each element on eight blanks based on the average blank value plus ten times the standard deviation of blanks. Outliers were highlighted and set aside via the Grubbs’ test (Miller et al., 2005). They are expressed in mg·kg-1 of dry weight: Ca: 30, P: 50, Mg: 10, Fe: 10, Zn: 3, Cu: 0.65, Mn: 1, Se: 0.05, Na: 35, K: 60, Ni: 0.4, As: 0.02, Sr: 9, Mo: 11, Cd: 0.05, Pb: 0.5, Hg: 0.03, Al: 30, Cr: 0.5, Co: 0.5.
3.2. Analysis of food samples and comparison with food composition tables
16In the Tibetan food samples analyzed, some of the studied elements were shown to be present at a level below the limit of quantification (Ni, Se, Mo, Cd, Pb, Hg, Cr and Co). The levels of aluminum in the foods analyzed were higher than the limit of quantification but no reference values were found in the FCTs. Therefore, none of the aforementioned elements will be discussed further in this study. As we have seen, one of the food samples analyzed here was black tea. In rural Tibet, this is quite an expensive commodity. It is brewed to a highly concentrated level, and then drunk in very diluted form. Consequently, its mineral composition is extremely poor and this food will therefore also not be discussed here. Furthermore, another of our foods originally chosen for analysis, yak butter, could not be analyzed in this study for reasons of stability and conservation during the transport of samples.
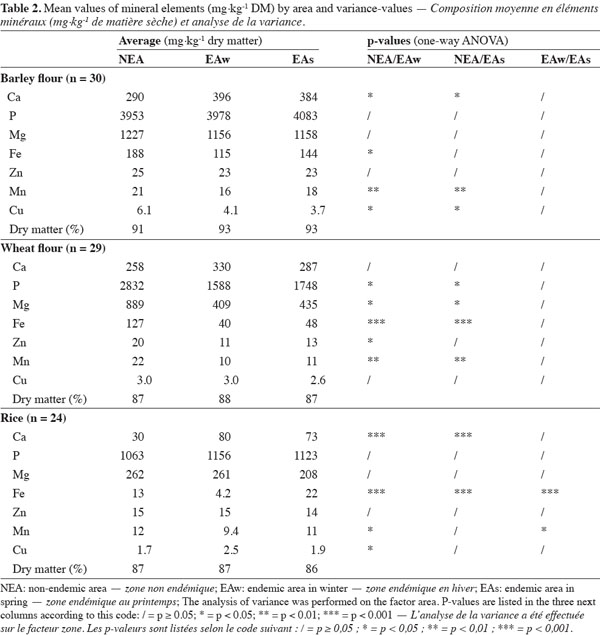
17Analyses of variance between food samples taken from the endemic area and the non-endemic area were conducted for the following elements: Ca, P, Mg, Fe, Zn, Cu, and Mn. Three staple food items, which were available in each area, were considered: roasted barley flour, wheat flour and rice (no potato was collected in the non-endemic area, and no radish was collected in the endemic area). Mean mineral content and p-values for these three staple foods are listed in table 2. The results show no significant variation in the mineral composition of barley flour and wheat flour during the year of sampling. They also reveal a very limited variation in the mineral composition – iron and manganese – of rice between the two seasons of sampling in the endemic area. On the other hand, the three staple food items presented some significant differences in mineral composition between the non-endemic area and the endemic area. Wheat flour showed the greatest difference in composition, with five significantly different minerals out of seven. Manganese was found to be present at significantly higher levels (p-value < 0.01) in the endemic area both in roasted barley flour and in wheat. Conversely, calcium content was found to be significantly lower in barley flour and in rice (p-value < 0.5 and < 0.001 respectively). Within the context of a poorly diversified diet, as is the case in rural Tibet (Liquiang et al., 1991; Suetens et al., 2001; Dang et al., 2004), these differences in mineral composition might lead to differences in daily mineral intake.
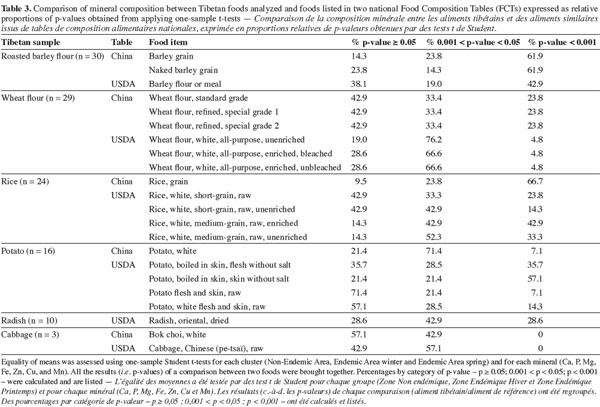
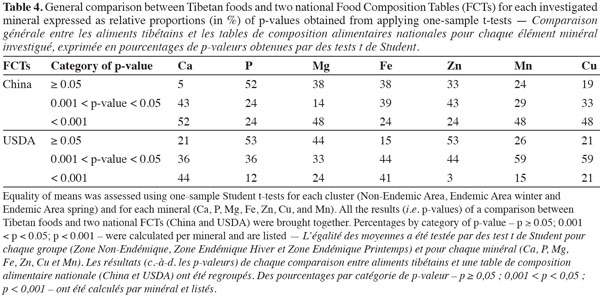
18Mineral composition (Ca, P, Mg, Fe, Zn, Mn and Cu) of the sample Tibetan foods was analyzed and means were calculated by area (Rinpung: non-endemic area, NEA; Nimo and Lhundrop: considered as one endemic area, for two seasons, spring and winter = EAs and EAw). Means were compared using one-sample Student t-tests against the mineral composition of foods listed in the two chosen FCTs (USDA and China). Certain foods listed in the FCTs were chosen for comparison with the samples based on their similarity. Results are summarized in table 3. The table lists the Tibetan food samples and the food items from the FCTs. For the sake of readability, all p-values of one comparison (Tibetan sample/food item) are shown together for all minerals, and expressed as a percentage by category of p-value (p > 0.05; 0.001 < p < 0.05; p < 0.001). As can be seen in the first category (p > 0.05), most food items from the FCTs present a different composition to the Tibetan foods analyzed. Except for potato flesh and skin, raw and potato, white flesh and skin, raw from the USDA FCTs and bok choi, white from the China FCTs, significant differences of more than 50% can be seen between the mineral composition of the Tibetan samples and that of the food items listed in the FCTs. Many even show a 60-70% difference. It is clearly sensible to determine a cut-off point when considering including or rejecting a similarity between food samples and FCTs, for example, concerning mineral content. The Canadian Food Inspection Agency tolerates a 20% difference between a labeled and a measured value for commercial products (Canadian Food Inspection Agency, 2003), whereas the French Association Nationale des Industries Alimentaires recommends a 40% level of accepted tolerance (Association Nationale des Industries Alimentaires, 2009). However, no mention is made by these agencies of the accumulation of differences, and our results showed that foods studied can be very different in terms of mineral composition when compared against similar foods listed in the two national FCTs. Nevertheless, the distribution of p-values seemed to be different according to the mineral element, as can be seen in table 4. Overall p-values for all foods investigated are shown for each FCT and for each mineral element, and are expressed as percentages. In both FCTs, and for most minerals, less than 50% of p-values are above 0.05, meaning that most of the mineral content levels in the sampled Tibetan foods were significantly different from those of the food items listed in the FCTs. The calcium content in the China FCTs was found to differ considerably from the calcium content in the Tibetan samples (only 5% of p-values > 0.05). Concerning the other elements, percentages of p-values > 0.05 ranged from 15 to 53%. Despite the small number of samples analyzed in the present study, this preliminary insight suggests that a nutritional survey in rural Tibet, based on food composition tables, could introduce a bias in the calculation of daily mineral intake, especially for calcium.
19Dry matter (DM) content was measured in all the food samples. The means of dry matter content of barley flour, wheat flour and rice are listed in table 2. The means of DM content for these three staple foods were also calculated by area by food item and compared using one-sample Student t-tests to similar foods listed in the two FCTs (USDA and China). The mean DM content of Tibetan barley flour was found to be significantly higher (p-values < 0.001) than the values found in both FCTs. One probable explanation for this comes from the fact that, in Tibet, barley is first roasted before grinding into flour. Overall, the DM content of our wheat flour and rice samples was quite close to the values shown in the FCTs (73% of p-values > 0.05). The DM content of Tibetan potato samples matched with only one food item from the USDA table (potato, boiled in skin, flesh without salt). Significant differences were found compared to other food items listed in the USDA and China tables (p-values < 0.05 and less). The DM content of the Tibetan dried radish samples was also found to be higher than that of its USDA homologue (radish, oriental, dried; p-value < 0.05). By contrast, the DM content of the Tibetan cabbage sample was found to be lower than the corresponding DM value for cabbage in both the USDA and the China FCTs (p-values < 0.01).
4. Conclusion
20As an endemic and chronic osteochondropathy affecting hundreds of thousands of people, Kashin-Beck disease remains misunderstood and little studied. Evidence indicates environmental causes, including a potential dietary imbalance, mainly of minerals and micronutrients. A more in-depth analysis of the mineral intake of people living in endemic areas might represent a further step towards understanding the disease.
21In anticipation of a forthcoming nutrition survey, this pilot-study was focused on the adequacy of the mineral composition of Tibetan foods in comparison with values shown in food composition tables. Main staple Tibetan foods were sampled once in Rinpung (non-endemic area, summer 2011) and twice (winter and spring 2010) in Nimo and Lhundrop (endemic area). The results revealed a very limited number of food/constituent pairs with a variation in mineral composition during a single year of testing in a given region. In addition, results showed significant differences in mineral content between the endemic area and the non-endemic area, particularly for wheat flour.
22The mineral content of sample Tibetan foods was statistically compared with similar foods listed in two food composition tables: the USDA National Nutrient Database (USDA Food Search for Windows, Version 1.0, database version SR23), and the China Food Composition Table (book 1, 2nd edition). More than 50 to 60% of p-values < 0.05 were highlighted, suggesting the inappropriateness of using FCTs as part of nutrition surveys in rural Tibet, and emphasizing the need for analysis of traditional foods. The difference between the mineral content of the sampled Tibetan foods and official listed values was the most marked for barley flour. In this particular case, it is important to note that there is no equivalent in the China Food Composition Table. Moreover, in Tibetan households, barley grains are first roasted before being ground into flour. This could partly explain the difference in mineral composition of the Tibetan samples compared to that of barley flour or meal as listed in the USDA National Nutrient Database (which probably undergoes industrial processing). Other reasons, which apply to all foods, may explain the differences between the mineral composition values of our Tibetan food samples and those listed in the two FCTs. The first reason is geographical distribution: the People’s Republic of China is a huge country with a vast and diverse landscape and an uneven distribution of population; hence there is a possibility of variation in the composition of foods across the region (Greenfield et al., 2003). The second reason is the fact that the cultivar, physiological state and maturity of plants when harvesting can also vary in Tibetan agricultural practices and can cause variation in mineral composition (Greenfield et al., 2003).
23It is clearly difficult to determine a cut-off point when considering the matching of food mineral content in specific food samples against food composition tables. Although it is obviously too early for definite conclusions to be reached (our analysis was carried out on only approximately 30 samples of each food), it seems that the present pilot-study indicates significant discrepancies between the values we measured and those listed in the food composition tables. In the present case, the results show that more food analyses are required to establish reliable nutritional reference values. Combined with nutrition surveys, these could contribute to an accurate calculation of the nutritional quality of food intake of Tibetan children.
24Acknowledgements
25This study was made possible thanks to the close collaboration and the support of the Center for Disease Control and Prevention of Tibet Autonomous Region (P.R. China). We are in debt to CLSA Hong Kong who supported financially this study.
Bibliographie
Association Nationale des Industries Alimentaires, 2009. Recommandations pratiques sur l’étiquetage nutritionnel, http://www.ania.net/ania/ressources/documents/3/E697FjGsS2P11mGO4cde6wMa.pdf, http://www.ania.net/ania/ressources/documents/3/E73BMgY9GEGGyr6D337y8Z21.pdf, (06.08.2012).
Baron R. & Tsouderos Y., 2002. In vitro effects of S12911-2 on osteoclast function and bone marrow macrophage differentiation. Eur. J. Pharmacol., 450(1), 11-17.
Canadian Food Inspection Agency, 2003. Nutrition labelling compliance test, http://publications.gc.ca/collections/Collection/A104-20-2003E.pdf, (06.08.2012).
Church S.M., 2006. The history of food composition databases. Nutr. Bull., 31(1), 15-20.
Dang S. et al., 2004. Poor nutritional status of younger Tibetan children living at high altitudes. Eur. J. Clin. Nutr., 58, 938-946.
Egan M.B. et al., 2009. User-centred food composition data-analysis of user needs through the Use Case approach. Food Chem., 113(3), 804-807.
Gibson R.S., 1990. Principles of nutritional assessment. Oxford, UK: Oxford University Press.
Goyens P. et al., 2008. Nutritional issues in KBD endemic rural areas. In: Malaisse F. & Mathieu F., eds. Big bone disease. A multidisciplinary approach of Kashin-Beck disease in Tibet Autonomous Region (P.R. China). Gembloux, Belgium : Les Presses Agronomiques de Gembloux, 75-80.
Greenfield H. & Southgate D.A.T., 2003. Food composition data: production, management, and use. 2nd ed. Roma: Food and Agriculture Organization of the United Nations.
Haubruge É. et al., 2000. La maladie de Kashin-Beck et le milieu rural au Tibet : un problème agri-environnemental. Cah. Agric., 9, 117-124.
Haubruge É. et al., 2001. The prevalence of mycotoxins in Kashin-Beck disease. Int. Orthopaedics, 25(3), 159-161.
Jacotot B. & Le Parco J.-C., 1992. Nutrition et alimentation. 2e éd. Paris : Masson.
Li S. et al., 2009. Soil selenium concentration and Kashin-Beck disease prevalence in Tibet, China. Front. Environ. Sci. Eng. Chin., 3(1), 62-68.
Linsinger T., 2005. European reference materials, application note 1, http://www.erm-crm.org/html/ERM_products/application_notes/index.htm, (09/07/10).
Liquiang X. et al., 1991. Selenium in Kashin-Beck disease areas. Biol. Trace Elem. Res., 31(1), 1-9.
Malaisse F. et al., 2008. Framework. In: Malaisse F. & Mathieu F., eds. Big bone disease. A multidisciplinary approach of Kashin-Beck disease in Tibet Autonomous Region (P.R. China). Gembloux, Belgium : Les Presses Agronomiques de Gembloux, 19-36.
Marieb E.N., 2005. Anatomie et physiologies humaines. 6e ed. Paris : Pearson Education Limited.
Martin A., 2000. Apports nutritionnels conseillés pour la population française. 3e éd. Paris : Lavoisier Tec & Doc Éditions.
Mathieu F. & Hinsenkamp M., 2008a. Kashin-Beck disease. In: Malaisse F. & Mathieu F., eds. Big bone disease. A multidisciplinary approach of Kashin-Beck disease in Tibet Autonomous Region (P.R. China). Gembloux, Belgium : Les Presses Agronomiques de Gembloux, 11-18.
Mathieu F. et al., 2008b. Physical therapy study. In: Malaisse F. & Mathieu F., eds. Big bone disease. A multidisciplinary approach of Kashin-Beck disease in Tibet Autonomous Region (P.R. China). Gembloux, Belgium : Les Presses Agronomiques de Gembloux, 61-64.
Matsumoto H., Silverton S.F., Debolt K. & Shapiro I.M., 1991. Superoxide dismutase and catalase activities in the growth cartilage: relationship between oxidoreductase activity and chondrocyte maturation. J. Bone Miner. Res., 6(6), 569-574.
Miller J.N. & Miller J.C., 2005. Statistics and chemometrics for analytical chemistry. 5th ed. Harlow, UK: Pearson Education Limited.
Moon C.S. et al., 1996. A comparison of the food composition table-based estimates of dietary element intake with the values obtained by inductively coupled plasma atomic emission spectrometry: an experience in a Japanese population. J. Trace Elem. Med. Biol., 10(4), 237-244.
Moreno-Reyes R. et al., 1998. Kashin-Beck osteoarthropathy in rural Tibet in relation to selenium and iodine status. N. Engl. J. Med., 339(16), 1112-1120.
Moreno-Reyes R. et al., 2001. Selenium deficiency-induced growth retardation is associated with an impaired bone metabolism and osteopenia. J. Bone Miner. Res., 16(8), 1556-1563.
National Institute of Nutrition and Food Safety China CDC, 2009. China food composition. 2nd ed. Beijing: Peking University Medical Press.
Pi M. & Quarles L.D., 2004. A novel cation-sensing mechanism in osteoblasts is a molecular target for strontium. J. Bone Miner. Res., 19(5), 862-869.
Sarazin M., Alexandre C. & Thomas T., 2000. Influence of trace element, protein, lipid, carbohydrate, and vitamin intakes on bone metabolism. Rev. Rhum., 67(7), 486-497.
Sctrick L., 1991. L’oligothérapie exactement. Limoges, France : Éditions Roger Jollois.
Shi Z. et al., 2009. Butenolide induced cytotoxicity by disturbing the prooxidant-antioxidant balance, and antioxidants partly quench in human chondrocytes. Toxicol. in Vitro, 23(1), 99-104.
Suetens C. et al., 2001. Epidemiological support for a multifactorial aetiology of Kashin-Beck disease in Tibet. Int. Orthopaedics, 25(3), 180-187.
US Department of Agriculture, Agricultural Research Service, 2010. USDA national nutrient database for standard reference, Release 23. Nutrient data laboratory home page, http://www.ars.usda.gov/ba/bhnrc/ndl, (09/07/10).
Wang S. et al., 2008. Detection of serum proteomic changes and discovery of serum biomarkers for Kashin-Beck disease using surface-enhanced laser desorption ionization mass spectrometry (SELDI-TOF MS). J. Bone Miner. Metab., 26(4), 385-393.
Wang W.Z. et al., 2009. Comparative analysis of gene expression profiles between the normal human cartilage and the one with endemic osteoarthritis. Osteoarthritis Cartilage, 17(1), 83-90.
Yamamuro T.Y., 2001. Kashin-Beck disease: a historical overview. Int. Orthopaedics, 25(3), 134-137.
Yang C. et al., 1993. Selenium deficiency and fulvic acid supplementation induces fibrosis of cartilage and disturbs subchondral ossification in knee joints of mice: an animal model study of Kashin-Beck disease. Virchows Archiv, 423(6), 483-491.
Pour citer cet article
A propos de : Michaël Dermience
Univ. Liege - Gembloux Agro-Bio Tech. Unité Analyse Qualité Risques. Laboratoire de Chimie analytique. Passage des Déportés, 2. B-5030 Gembloux (Belgium). E-mail: m.dermience@ulg.ac.be
A propos de : Françoise Mathieu
Kashin-Beck Disease Fund Asbl-Vzw. Rue de l'Aunée, 6. B-6953 Forrières (Belgique).
A propos de : Jean-Paul Barthélemy
Univ. Liege - Gembloux Agro-Bio Tech. Unité Analyse Qualité Risques. Laboratoire de Chimie analytique. Passage des Déportés, 2. B-5030 Gembloux (Belgium).
A propos de : Philippe Maesen
Univ. Liege - Gembloux Agro-Bio Tech. Bureau Environnement et Analyses de Gembloux. Passage des Déportés, 2. B-5030 Gembloux (Belgique).
A propos de : Jean-Michel Romnee
Centre Wallon de Recherches Agronomiques. Unité Technologies de la Transformation des Produits. Chaussée de Namur, 24. B-5030 Gembloux (Belgique).
A propos de : Viviane De Maertelaer
Université Libre de Bruxelles – SBIM and Institut de Recherche Interdisciplinaire en Biologie humaine et moléculaire. CP602. Route de Lennik, 808. B-1070 Bruxelles (Belgique).
A propos de : Dechen Yangzom
Kashin-Beck Disease Foundation. Gakyiling Hotel. Tuanjie Xincun. Sera Road. 850 000 Lhasa (TAR, P.R.China).
A propos de : Pema Tsewang
Chinese Center for Disease Control and Prevention. 850 000 Lhasa (TAR, P.R.China).
A propos de : Georges Lognay
Univ. Liege - Gembloux Agro-Bio Tech. Unité Analyse Qualité Risques. Laboratoire de Chimie analytique. Passage des Déportés, 2. B-5030 Gembloux (Belgium).