


- Accueil
- volume 16 (2012)
- numéro 4
- Definition of key parameters for constructing an online reference micrographs collection of processed animal particles in feed


Visualisation(s): 17642 (25 ULiège)
Téléchargement(s): 96 (2 ULiège)

Definition of key parameters for constructing an online reference micrographs collection of processed animal particles in feed

Notes de la rédaction
Received on August 16, 2011; accepted on April 20, 2012
Résumé
Définition des paramètres fondamentaux pour la réalisation d’une collection de micrographies de référence en ligne relative aux particules de farines animales dans les aliments pour animaux. Le Laboratoire de Référence de l’Union Européenne pour la détection des protéines animales dans les aliments pour animaux (EURL-AP) a développé une collection de micrographies en ligne soutenant le réseau d’activités de l’Union européenne pour la détection des sous-produits animaux interdits dans l’alimentation animale. Jusqu’à présent, la seule méthode officielle pour la détection de ces sous-produits est la microscopie classique, une méthode fortement dépendante des compétences du microscopiste vu la nécessité de reconnaitre les particules. Dans le but d’aider le réseau de microscopistes à atteindre un haut niveau de compétence, il a été nécessaire de créer une base de référence en ligne constituée de micrographies et accessible via une plate-forme Intranet. Les membres des Laboratoires Nationaux de Références pour les protéines animales dans les aliments pour animaux (NRL-AP) et l’Association Internationale pour l’Analyse de l’Alimentation Animale – Section Microscopie de l’Alimentation Animale (IAG) bénéficient de l’accès à cette collection de micrographies. Cet article décrit la création de la collection en ligne et les conditions qui ont dû être respectées afin d’y parvenir. L’article décrit également comment l’information est périodiquement mise à jour et associée à chaque micrographie. La nécessité d’un système robuste de centralisation de l’information lié à toute l’activité de recherche de ce projet et l’évaluation de l’utilisation de la collection en ligne seront également abordés.
Abstract
The European Union Reference Laboratory for the detection of animal proteins in feedingstuffs (EURL-AP) has developed an online micrographs collection supporting its network activities within the European Union for the detection of prohibited animal by-products in feed. So far, the only official method for detecting these by-products is light microscopy, which is highly dependent on the skills of a microscopist because it relies on particle recognition. In order to help the microscopist network to achieve high proficiency levels, it was necessary to create an online reference tool based on micrographs and accessible via an Intranet platform. Members of the National Reference Laboratories for animal proteins in feedingstuffs (NRL-AP) and the International Association for Feedingstuff Analysis – Section Feedingstuff Microscopy (IAG) have access to this micrographs collection. This paper describes how the online collection was created and what conditions had to be taken into account in creating such a tool. It also describes how information are periodically updated and managed within the context of the large amount of information included in each micrograph. The need for a robust back-office system as the foundation for all the research activities in this project is also covered, and the evaluation of the use of the online collection is discussed.
Table des matières
1. Introduction
1In the European Union (EU), Community Reference Laboratories (CRLs), now called European Union Reference Laboratories (EURLs), were created in order to ensure high-quality official feed and food controls, uniformity of results, assistance in correctly applying existing methods, and uniformity of regulations within the network of National Reference Laboratories (NRLs) (European Commission, 2004). In 2006, the Walloon Agricultural Research Centre (CRA-W) was chosen by the European Commission (EC) as the CRL for detecting animal proteins (AP) in feedingstuffs (CRL-AP) (European Commission, 2006), at a time of global concern about Transmissible Spongiform Encephalopathies (TSE). Currently, with some exceptions such as fishmeal, processed animal proteins (PAPs), including meat-and-bone meal (MBM), are banned as feed ingredients for farmed animals, apart from carnivorous fur-producing animals and pets. The use of PAPs is strictly controlled in the EU through several complex regulations, recently reviewed by Fumière et al. (2009) and Liu et al. (2011).
2The European Union Reference Laboratory for the detection of animal proteins (EURL-AP) has to ensure the correct implementation of the official method for detecting constituents of animal origin in feed (defined as products from processing the bodies and body-parts of mammals, poultry and fish), based on microscopic examination (European Commission, 2009).
3Pinotti (2009) stressed that the accuracy of qualitative and quantitative estimates using microscopic methods depends largely on the experience of the analyst. This experience relies entirely on the ability of the microscopist to recognize well-characterized structures from animal origin (i.e., bones, fish bones, hair fragments, feathers). The need for visual references allowing accurate identification of these structures was therefore requested (Bates et al., 1992; Klein et al., 2005). This paper describes the development of an unique online micrographs collection intended to help the network of microscopists from the NRLs but extendable to other communities. It focuses on the technical requirements, the management of the data and images, the continuous upgrading of the collection and the benefits of using the collection.
2. A web-based technology
4The communication of EURL activities and related information through EU Member States is an important priority for the European Commission (EC). The first year of the EURL-AP work programme therefore included the development of a public website and a secure communication tool for the network of National Reference Laboratories for animal proteins in feedingstuffs (NRL-AP). Currently, this network consists of 26 national institutes. The public EURL-AP website created by CRA-W is an efficient way to disseminate information to stakeholders and the general public. It presents general facts and figures such as descriptions of EURL-AP missions, legal sources supporting its activities, lists of publications and reports, the contact information of the national food and feed agencies in the NRL-AP network, news and events, and so on.
5As a high proportion of scientific information from the EURL-AP originates from research activities conducted jointly with NRL-APs and other associated scientists (e.g., through collaborative studies, proficiency tests, validation studies of new methods, experimental protocols), strict confidentiality is necessary. To address the need for the secure exchange of data among network partners, a dedicated Intranet platform was created. It is used for a range of centralized services: sharing protocols, sharing forthcoming conference agendas, training and educational support. To create the Intranet platform, Microsoft Windows SharePoint Services 2003® version 2.0 was selected and installed (Microsoft, 2006). As noted by Vermeulen et al. (2009), the success of CRA-W’s IT team in various European projects (e.g., Stratfeed, Trace) using MS SharePoint was the basis for selecting this software. A secure website server certificate (SSL128) was installed. Access to the content of this Intranet is restricted to the NRL-AP’s partners. Users access it with login and password details that are managed and delivered by the EURL-AP IT team. Access rights vary depending on the role of the user (e.g., administrator, NRL member, EU or non-EU scientific contact, EURL-AP staff, technical expert group); the management levels within the Intranet are defined according to these roles. The management levels are essentially permissions defined for viewing, inserting, editing or deleting content on the Intranet workspaces and pages. These levels are supervised by a webmaster in close collaboration with the coordination team and the scientific committee (Figure 1). The access rights are also useful for managing communication with the users. The users are kept informed of every change on the Intranet via an installed alert system. This system sends an alert e-mail to users immediately after any change (e.g., posting a new announcement, or a new micrographs release), notifying them of such changes. The alert system does not supply audit trails which are not indispensable because any change being generated by the EURL-AP or by an authorized user, as defined by the access rights, will generate a new alert to the whole community of users. Furthermore even changes of an alert message by the EURL-AP or another party generate a new alert e-mail informing the users about this modification.

6One of the centralized services and workspaces of this Intranet is the online EURL-AP micrographs collection with its own dedicated access rights. This collection is intended mainly for the NRL-APs, but not restricted to them. Since 2009, members of the International Association for Feedingstuff Analysis - Section Feedingstuff Microscopy (IAG) have been given, as specific users, limited access rights to the micrographs collection workspace, excluding all other confidential Intranet content (Figure 1). So far, 127 personal access accounts to the Intranet have been created, of which 17 have access only to the EURL-AP micrographs collection (IAG members).
7Users go through two stages when consulting the online micrographs collection. Those with permission first have to enter the secure Intranet site, which they do either via the EURL-AP public website that connects to the Intranet through a login dialog box, or directly by using the Hypertext Transfer Protocol Secure (HTTPS) URL address. Then, once inside the Intranet, they can open the micrographs collection by a simple click on a hyperlink item in the main menu.
3. From shooting images to Intranet posting
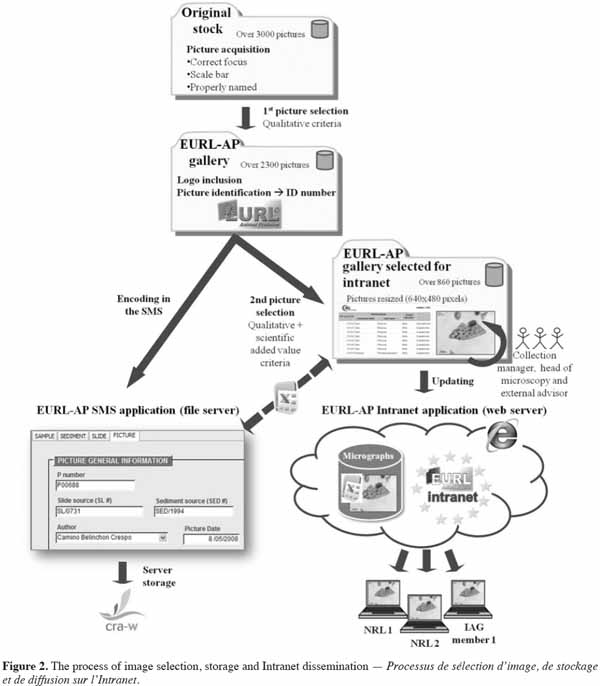
8The EURL-AP online micrographs collection is a reference library of microscopic images, based on clearly identified and characterized samples from the EURL-AP sample bank. The quality of the images and the relevance of information are therefore essential. A strict selection process (described in figure 2) is crucial. Each new compilation (or new release from the micrographs collection) follows a specific sequence of events in order to ensure optimal image quality and the most relevant information being available for feed microscopists.
9Images are taken by well-trained dedicated staff adhering to optimal shooting conditions. These conditions are: a color temperature of 3,200 K, the use of neutral filters to adapt light intensity and to prevent excessive brightness, optimal exposure time, pre-improvement of gamma, color balance and good contrast.
10Micrographs are taken with an AxioCam MRc camera (Carl Zeiss, Göttingen, Germany) coupled with a 0.63x camera port for an Axio Imager A1 microscope (Carl Zeiss, Göttingen, Germany). The image processing software is Axiovision 4.8 (Carl Zeiss, Göttingen, Germany). Stereomacroscopic records are taken by a DP200 camera of 1.3 mega pixels (Deltapix, Maalov, Denmark), coupled with a 1.0x camera port to a Stemi 2000 - C stereomicroscope (Carl Zeiss, Göttingen, Germany). The software for this camera is DpxView Pro Application (Deltapix, Maalov, Denmark). Various microscopic techniques are used: bright field, dark field, polarization, differential interferential contrast (DIC), and UV fluorescence.
11Each micrograph is provided with a scale bar adapted to the final magnification calculated by the software used, and calibrated by a stage micrometer. Each image file is recorded in JPEG format (1,384 x 1,036 pixels) with a minimal 5% compression level. Although the lossy compression the image quality is almost unaffected compared to the original ZVI format. Furthermore JPEG is preferred upon other formats (TIFF, BITMAP) proposed by Axiovision 4.8 for its compatibility with the used copyright encryption software, its portability and its speed of Internet file transmission due to the size reduction.
12In order to facilitate recovery in case of database failure, the image files are stored on two hard disks using a storage technology that combines multiple disk drive components into a logical unit (RAID 1), a redundant array of independent disks. Each image file is accompanied by all relevant information, including: original sample identification code and/or slide code, sample fraction used, staining used, mounting medium used and shooting conditions. These files are stored at CRA-W in a single directory called “original stock”, which had more than 3,000 images on 29 July 2011 (Figure 2).
13From this original stock, the first selection is made by the micrographs collection manager. The time lapse between the shooting session and the first selection is at least 7 days. Such period of time is recommended in order to ensure the impartiality of the selection process (i.e., that it is not influenced by the previous shooting session). The criteria for the first selection are primarily qualitative (correct color balance, correct light intensity, correct focus, etc.). Often, the selection is based on batches of images on the same topic, with a view to the next release. The selected images from the first selection are then stored in a second directory called the “gallery” (Figure 2), which holds about 2,300 images. This gallery constitutes the whole EURL-AP micrographs database.
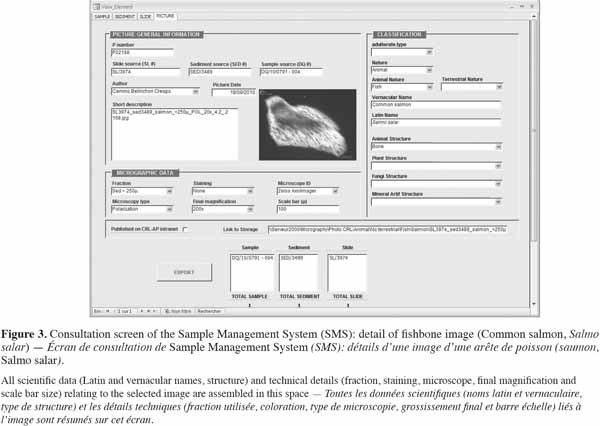
14Images being placed in the gallery go through several operations. First, an engraved copyright logo is inserted on each image using Batch Watermark Creator (Easy Tools, Inc.). The image file is then manually given a unique ID number. The image, with its ID number and accompanying information, is then directly encoded in a homemade Access application called a Sample Management System (SMS; see next section for details). All the gallery data are centralized in the SMS (Figure 2), matching both, the gallery database and the SMS application. This allows a direct preview of the images when consulting the SMS (Figure 3). The gallery constitutes the micrographic collection that supports almost all EURL-AP activities (i.e., scientific research, training and educational services), as well as the EURL-AP micrographs collection.
15The preparation for putting new EURL-AP micrographs collection releases on the Intranet, usually every 4-6 months, starts with the images files from the gallery. Updating and enlarging the micrographs collection is a multiple-step process requiring three people: the micrographs collection manager, the head of the microscopy laboratory and an external assessor. The first operation is carried out by the micrographs collection manager and involves selecting gallery images taken since the previous release, based on an agreed theme for the new release. The head of the microscopy laboratory then fine tunes the selection based on the scientific added value of the micrographs and qualitative criteria. Micrographs that do not present clearly identified structures are systematically rejected from the selection. Redundancy in the online micrographs collection is strictly controlled by eliminating images whose content is very similar to already published micrographs. However, this process does take account of the large diversity of some key structures involved in particle identification (e.g., lacunae shape of bones, organizational pattern of osteocyte’s canaliculi, fish scale types and morphologies); multiple micrographs illustrating the variability of such structural details are therefore selected. Similarly, several images of the same object taken using different microscopic techniques (that could reveal better discriminatory markers) would be selected for online publication. Once the selection is made, the new release is then validated. To get an accurate appreciation of quality, this approval step is carried out in a projection room on a slide screen and each image is discussed in terms of its relevance to the collection.
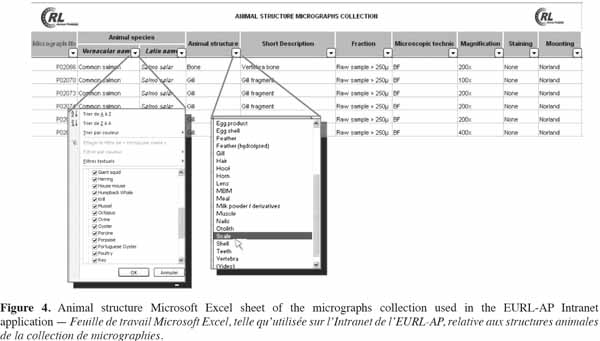
16At this point, some technical operations are needed prior to uploading the release images (Figure 2). The images are resized to a 640 x 480 pixels format in order to optimize the online consultation. All information on the micrographs are transferred automatically from the SMS to an Excel file that is consulted online by users (Figure 4). Further layout adaptation of the Excel file is manually completed, its content is read through carefully and a random check is done of the data match between the Excel file and the micrographs. The last stage of the process involves uploading the image files and the updated Excel file onto the EURL-AP Intranet. Uploads generate an automatic announcement of the new release, which is sent out by alert e-mail to all users of the EURL-AP online micrographs collection.
4. Back-office data management using SMS, a homemade solution
17The research activity supporting the EURL-AP micrographs collection generates metadata and information that need to be managed both for traceability and daily consultation. The EURL-AP gallery, used on a daily basis, has more than 2,300 image files. Some 85% of these files originate from microscopic observations from permanent slides. The use of permanent slides is crucial for PAP detection in feed, as discussed by Veys et al. (2010). The use of a polymerized resin mounting medium (NOA 65) ensures that the slides remain in good condition for years. Thousands of permanent slides are stored at the EURL-AP, as well as a large collection of sediments obtained from feed and feed ingredients. Each image file must be accompanied by such information as the fraction type or sediment used and the original sample identification, as well as other technical data (cf. previous sections). These data have to be accessible for traceability and further complementary analytical work. In order to manage this information properly, the EURL-AP has developed the SMS, a fully integrated homemade tool (Figures 2 and 3). It is a database application developed with Microsoft Access 2003®. This development platform was chosen because of its standard language (Visual Basic for Application), its multiple-user potential and its reliability. The SMS uses the database engine Microsoft SQL Server Desktop Engine (MSDE). A homemade system has several advantages, including ownership of the source code, which is required for future adaptations. With this system, all data about samples, sediments, slides and images, and the relationships between them, are collected and integrated by using a relational database model that enables the different tables to be linked and combined.
18The consultation SMS screen (Figure 3) shows in a single window all the scientific data and technical details about the selected image. These data are arranged in three groups:
191. general information about the image that include laboratory details, such as ID number, sediment and sample from origin, dates and author of the slide;
202. micrographic data that include technical information about the image;
213. classification information, which focuses on the scientific aspects of the particle in the image.
22A direct image preview is possible thanks to the link with the image database. Export macros to Excel lists have also been developed for query results.
5. Architecture of the micrographs collection
23It was decided to keep consultation and use as simple as possible for each user, taking account of the fact that the limitations and diversity of IT platforms within the user network could generate problems. The architecture of the micrographs workspace is therefore as follows: there are two folders (or directories), one for the “macroscopic particles” and the other for the “microscopic particles”, depending on whether shooting the image involved using a stereomicroscope or a compound microscope, respectively. There are also two Excel files in the micrographs workspace: the micrographs collection file in se and an identification key for rodents.
24In the two folders, all image files are identified by their ID number and carry a very short description. The description (up to two words) is intended to give users an idea of the content of the micrograph. This facilitates searching in the micrographs collection Excel file. This file is the necessary complement to the micrographs, as it contains the complete information (scientific data and technical details) on each image in the collection. The file is write-protected in order to prevent accidental change by users, and it is divided into five worksheets. An introductory worksheet provides guidelines on how to use the Excel file and how to find useful information via the other worksheets. The other four worksheets contain detailed information classified according to the nature of the principal structures on the micrographs (i.e., animal, plant, fungal, mineral and artificial structure). Automatic filters are available for the multiple search options (Figure 4). These options are: micrograph number of the image, the vernacular and Latin names of species (e.g., common salmon, Salmo salar), the type of structure illustrated (e.g., bone), the sample fraction (e.g., sediment < 250 µm), the microscopic technique used (e.g., compound microscope in bright field [BF]), the final microscopic magnification (e.g., 200x), the staining (e.g., none) and the mounting medium used (e.g., Norland Optical Adhesive 65) (Figure 4).
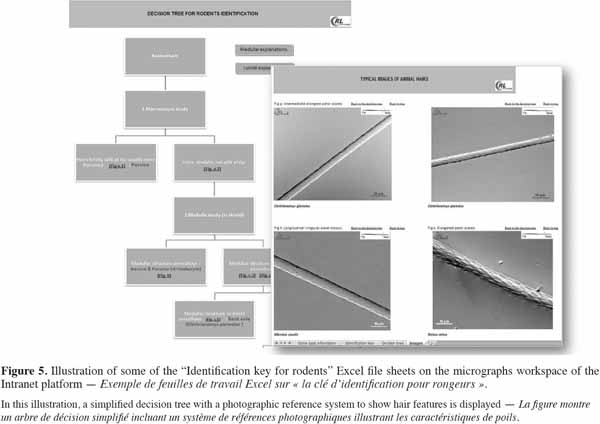
25The Excel file related to rodent identification draws on research carried out at the EC’s request. It puts forward solutions for identifying feed contamination caused by the natural presence of common rodents (e.g., rats, mice and bankvoles) and lagomorphs (rabbits and hares). It contains a simplified identification key for animal hairs based on their microscopic analysis. Apart from the identification key, the file has a dynamic decision tree, reinforced by hyperlinks to micrographs, illustrating the morphological hair features that could enable species origin to be deduced (Figure 5).
6. Discussion and perspectives
26Given that the skills and experience of microscopists are essential for the correct detection and identification of particles, the creation of the reference micrographs collection described became mandatory. Doubts about particles to be identified under the microscope can in most cases immediately be erased through this consistent and reliable source of visual information.
27As far as we know, the collection is currently the largest one of its kind, illustrating a huge diversity of images relating to animal origin and compound feeds. Within the collection are images of common components or contaminants in feedingstuffs (e.g., terrestrial and fish bones, muscles, teeth, milk powder), as well as less common ones. Examples of less common components include placoid scales from cartilaginous fish and bones that are not easily recognizable, such as the bones of salmon that are almost devoid of canaliculi (Figure 6).
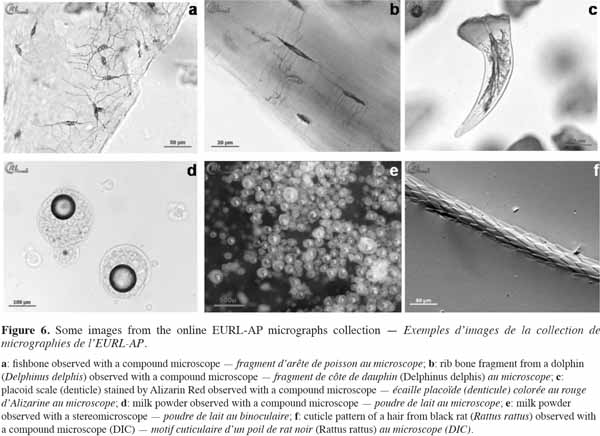
28In the light of current concerns about food and feed safety and at the request of the NRLs, this collection is continuously being enlarged, with a meticulous selection of relevant images made periodically for online posting. An example of such concerns is the natural contamination by animal particles of both compound feed and fishmeal. There is a real risk of the accidental presence of rodents in compound feed. Live species can be caught during crop harvesting or be naturally present in storage places, attracted by the feed. This natural contamination is evidenced by the presence of a few small terrestrial bones in the compound feed. This concern was the trigger for research on identifying common rodents and lagomorphs (see previous section). Another example of natural contamination is the occasional presence of remainings of sea mammals in fishmeal. This is because they are accidentally trapped in fishing nets and therefore included in the fishmeal production process. To help address the problem of bones in fishmeal being incorrectly identified as terrestrial ones, images of the bones of sea mammals (e.g., porpoise, seal, dolphin and whale) are included in the collection (Figure 6b), for comparative purposes.
29The Intranet collection now has more than 860 accessible online images, making it an important e-learning source. Skills can be improved easily with access to such an online collection from different locations provided through a simple Internet connection. The automatic filters enable training to be organized around specific topics (e.g., training in muscles or scales identification). This also gives users the option of working directly on the worksheet where desired structures are included and selecting the specific details wanted. During analysis, a microscopist will often come across unknown particles in fishmeal. Using the filters, the microscopist can select all image files showing fish particles, and thus have an immediate overview of the diversity of fish particles, enabling him/her to confirm or reject the fish origin of suspect particles. In addition, within the fish images a microscopist can select all scale images in order to conduct a more detailed study of the diversity of those structures (Figure 4).
30All users of the collection can ask to receive images in their original size from the EURL-AP. By agreement, they are free to use the EURL-AP images for any publication or for training purposes, provided they mention the source. Apart from its online use, the collection images are seen as references for other scientific tools developed for identifying animal proteins in feed. For example, some images were used to create the new version of ARIES, an identification and evaluation system set up within the STRATFEED project (2001-2004) (Van Raamsdonk, 2004; Van Raamsdonk et al., 2007). Images from the collection were also used in compiling the new edition of an agricultural microscopy manual (Makowski et al., 2011) for microscopists at the start of their career, and also as a reference for more experienced ones.
31This online tool opens doors to new methods of reference image dissemination as alternatives to the traditional tools such as books or manuals on feed microscopy (Gassner, 1931; Klein et al., 2005). Books often contain line-drawings, which are practical for learning about particles’ specific features, but these illustrations do have a tendency to “idealize” the depicted structures. Micrographic images, however, provide a true image of the particles, illustrating the difficulties of recognizing them under the microscope. With the use of such tools as PowerPoint® presentations for training, the easy acquisition of micrographs in JPEG format prevents the need to scan images from books, images that are often devoid of color or any reference to size (scale bars). Scanning often reduces the quality of images, with the related loss of detailed information of substructures. In addition, books can become obsolete and acquiring new editions can be expensive. Online collections give the user the ability to print images at the required size to add to homemade manuals that can be updated by adding new images from periodical releases. Despite all these advantages of online sources over printed ones, there are some drawbacks. Access to online collections is limited to people with a computer and an Internet connexion, and there is room for improvement in terms of dynamic consultation and user-friendliness. This would certainly be relevant if access to the collection, upon agreement by the EC, could be open to a larger community of specialists, which is already realistic to implement due to the security features in place. However, it needs to be stressed that the collection was developed by a scientific team whose main focus was on advances in agricultural sciences, and not in IT technology.
32There has been a lot of feedback on the effectiveness of the online tool from the target network of laboratories. Formerly, laboratories facing problems with microscopic identification that could lead to false positive or false negative results had to request assistance from the EURL-AP by e-mail or phone. This could be ineffective and time consuming. As laboratories have begun to make more use of the online micrographs collection, these requests have fallen considerably and the laboratories have become more independent. This has not, however, reduced communication between the laboratories and the EURL-AP where such communication is necessary. For example, laboratories can still contact the EURL-AP by sending in their own images of structures that are difficult to identify. The answers given by the EURL-AP team often refer to published images from the collection that are morphologically close to the structures in question. Thus, discussion is facilitated by referring to a shared database. In addition, by encouraging the microscopist network to consult this database, the educational function of the collection is fulfilled. Frequent consultation helps the microscopists to develop their skills on their own and to retain records of reference images.
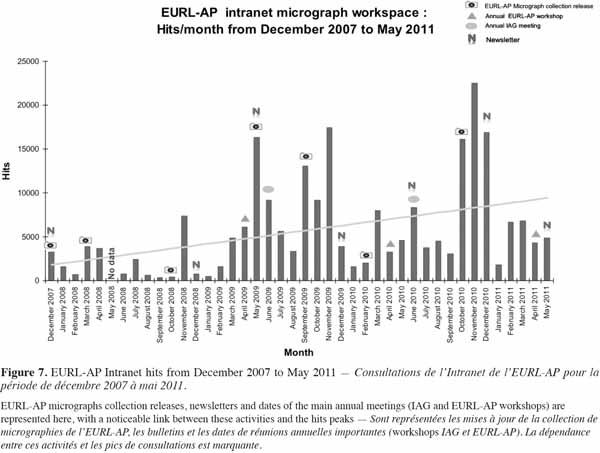
33The consultation hits since the creation of the online micrographs collection (Figure 7) confirm the interest in it and its use by the laboratory network. The number of visits tends to increase significantly when there are micrographs collection releases. This illustrates that the collection needs active and ongoing content management in order to keep network members interested. EURL-AP events (e.g., annual meetings and newsletters) and meetings of other microscopy groups, such as the IAG, also have a positive impact on the number of visits. In May 2009, for example, 16,336 hits were recorded after the posting of an EURL-AP newsletter and a micrographs collection release. In November 2010, 22,469 hits were recorded; in view of the number of users, this represents very high activity that month. Interestingly, this last increase in visits coincided with the EURL-AP’s official annual proficiency test organized each autumn by the EC and in which the whole NRL network participates.
34Clearly, the Intranet platform and the online micrographs collection currently represent a more effective and efficient means of sharing documents and information with a network of laboratories as compared to traditional methods. Although there are improvements to be made, it is already seen as user-friendly and is easily updated. The success of the online collection should encourage the development and implementation of similar systems for comparable research projects involving networking partners and high level of expertise.
35Acknowledgements
36This work was funded by the European Community under the first 5-year plan of the European Union Reference Laboratory for the detection of animal proteins in feedingstuffs (EURL-AP). The project was carried out by a network coordinated by the Walloon Agricultural Research Centre (CRA-W) in Belgium and included 26 partners in Europe. The information in this paper reflect the authors’ views; the European Commission is not liable for any use of the information contained herein. The authors also wish to thank the following contributors to the development of the micrographs collection and the Sample Management System (SMS): Isabelle Fissiaux, Benoît Scaut, Daniele Bonsignori and Alexandre Quoitot.
Bibliographie
Bates L. et al., 1992. Manual of microscopic analysis of feedstuffs. 3rd ed. Charleston, WV, USA: The American Association of Feed Microscopists (AAFM).
European Commission, 2004. Commission Regulation (EC) No 882/2004 of the European Parliament and of the Council of 29 April 2004 on official controls performed to ensure the verification of compliance with feed and food law, animal health and animal welfare rules. Off. J. Eur. Union, L 165, 30.4.2004, 1-141.
European Commission, 2006. Commission Regulation (EC) No 776/2006 of 23 May 2006, amending Annex VI to Regulation (EC) No 882/2004 of the European Parliament and of the Council as regards Community reference laboratories. Off. J. Eur. Union, L 136, 24.5.2006, 3-8.
European Commission, 2009. Commission Regulation (EC) No 152/2009 of 27 January 2009 laying down the methods of sampling and analysis for the official control of feed. Off. J. Eur. Union, L 54, 26.02.2009, 1-130.
Fumière O. et al., 2009. Methods of detection, species identification and quantification of processed animal proteins in feedingstuffs. Biotechnol. Agron. Soc. Environ., 13(S), 59-70.
Gassner G., 1931. Mikroskopiche untersuchung pflanzlicher. Jena, Germany: Gustav Fischer.
Klein H. & Marquard R., 2005. Atlas for the microscopic examination of feed containing vegetable and animals products. Bergen/Dumme, Germany: Agrimedia.
Liu X. et al., 2011. An overview of the legislation and light microscopy for detection of processed animal proteins in feeds. Microsc. Res. Tech., 74(8), 735-743.
Makowski J., Vary N., McCutcheon M. & Veys P., 2011. Microscopic analysis of agricultural products. 4th ed. Urbana: AOCS Press.
Microsoft, 2006. Windows Share Point Services 2.0 Overview, http:/www.microsoft.com/technet/windowsserver/sharepoint/V2/techinfo/overview.mspx, (16/03/2009).
Pinotti L., 2009. Image analysis and microscopy: a useful combination. Biotechnol. Agron. Soc. Environ., 13(S), 21-24.
Van Raamsdonk L.W.D., 2004. The decision support system ARIES. In: International symposium on food and feed safety in the context of prion diseases, 16-18 June 2004, Namur, Belgium.
Van Raamsdonk L.W.D. et al., 2007. New developments in the detection and identification of processed animal proteins in feeds. Anim. Feed Sci. Technol., 133, 63-83.
Vermeulen P. et al., 2009. Web-based communication tools in a European research project: the example of the TRACE project. Biotechnol. Agron. Soc. Environ., 13(4), 509-520.
Veys P. & Baeten V., 2010. New approach for the quantification of processed animal proteins in feed using light microscopy. Food Addit. Contam., 27(7), 926-934.
Pour citer cet article
A propos de : Camino Belinchón Crespo
Walloon Agricultural Research Centre (CRA-W). Food and Feed Quality Unit (U15). Valorisation of Agricultural Products Department (D4). Chaussée de Namur, 24. B-5030 Gembloux (Belgium).
A propos de : Pascal Veys
Walloon Agricultural Research Centre (CRA-W). Food and Feed Quality Unit (U15). Valorisation of Agricultural Products Department (D4). Chaussée de Namur, 24. B-5030 Gembloux (Belgium). E-mail: p.veys@cra.wallonie.be
A propos de : Philippe Vermeulen
Walloon Agricultural Research Centre (CRA-W). Food and Feed Quality Unit (U15). Valorisation of Agricultural Products Department (D4). Chaussée de Namur, 24. B-5030 Gembloux (Belgium).
A propos de : Vincent Baeten
Walloon Agricultural Research Centre (CRA-W). Food and Feed Quality Unit (U15). Valorisation of Agricultural Products Department (D4). Chaussée de Namur, 24. B-5030 Gembloux (Belgium).