


- Portada
- Volume 14 (2010)
- numéro spécial 2
- Impact of scaled-down on dissolved oxygen fluctuations at different levels of the lipase synthesis pathway of Yarrowia lipolytica


Vista(s): 2179 (22 ULiège)
Descargar(s): 0 (0 ULiège)

Impact of scaled-down on dissolved oxygen fluctuations at different levels of the lipase synthesis pathway of Yarrowia lipolytica

Résumé
Impact des fluctuations en oxygène dissous à différents niveaux de la synthèse de lipases par Yarrowia lipolytica. L'influence des fluctuations de la concentration en oxygène dissous sur la production de lipase par Yarrowia lipolytica a été étudiée dans des bioréacteurs scale-down permettant de reproduire à l'échelle du laboratoire les fluctuations caractéristiques de l'échelle industrielle. Dans notre cas, ces fluctuations ont été générées par un système de contrôle de la vanne d'admission d'air du bioréacteur. Différentes fréquences d'ouverture/fermeture de la vanne d'admission d'air ont été considérées et leur impact a été estimé à trois étapes de synthèse de la lipase : l'expression du gène LIP2 codant pour la lipase (par RT-qPCR), la traduction des ARNm en protéine (par un système rapporteur LacZ) et l'excrétion de la lipase dans le milieu de culture (par dosage de l'activité lipase dans le milieu de culture). De cette manière, il a pu être montré que les fluctuations en oxygène dissous affectent la synthèse de la lipase au niveau transcriptionnel.
Abstract
The impact of the fluctuations in dissolved oxygen tension (DOT) on the lipase production by Yarrowia lipolytica has been investigated in a scale-down reactor (SDR). This bioreactor comprises a 20 l agitated vessel with an automatic valve controlling the opening and closure of the air flow line. This kind of scale-down apparatus is used in order to generate DOT gradients encountered in large-scale, while maintaining the other environmental conditions constant. The impact of DOT fluctuations has been estimated at three levels of the lipase synthesis machinery: lipase gene expression, lipase translation, lipase excretion to the extracellular medium. Among these levels, the performance of lipase production under oscillating DOT was significantly affected at the lipase gene expression level.
Tabla de contenidos
1. Introduction
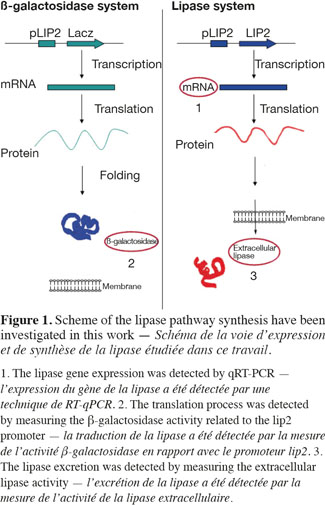
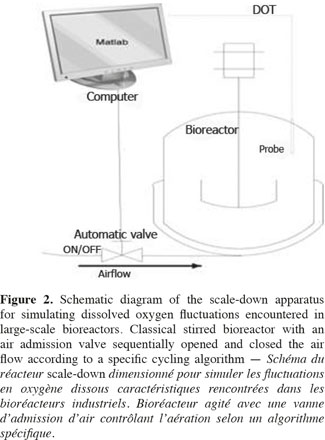
1Microbial lipases have received increasing interest due to their wide variety of utilization (Jaeger et al., 1994). The intensive production of lipase application requires the development of adequate large-scale cultivation methods. However, the optimal conditions of lipase production and the influence of extracellular factors (such as the carbon source level, pH, dissolved oxygen tension, nitrogen source, etc.) are determined generally at laboratory scale for economic reason, and then the results are translated to the industrial scale. However, large-scale bioreactors exhibit lower mixing efficiency and the presence of spatial concentration gradients disturbing the microbial metabolism is an important problem that is frequently encountered in these bioreactors. It is possible to predict the potential problems at industrial scales by representing the existence of environmental gradients in specially designed scale-down reactors (SDR). The scale-down methodology has been first proposed by Oosterhuis et al. (1985) and consists to design lab-scale bioreactor in order to reproduce mixing imperfections experienced at the industrial level. The SDR is used to evaluate the effects of environmental gradients at the level of the culture performances. Such a methodology allows to identify the causes of existing problem, and to design a better scaling-up and operational strategies (Lara et al., 2006). In a previous work, our group has demonstrated the effect of different extracellular factors on the lipase production by using different scale-down strategies. Those parameters were the carbon source accessibility (methyl oleate has been used as a carbon source and must be efficiently dispersed in the aqueous culture media), oscillating dissolved oxygen tension (DOT), and pH fluctuations (Kar et al., 2008). The effect of DOT fluctuations has been observed to be predominant by comparison with the methyl oleate dispersion efficiency and the pH gradient. The DOT level affects the lipase specific productivity owing to the fact that oxygen participates in the growth rate, primary metabolism of aerobic microorganisms, and as the substrate of various enzymes in various pathways for the production of secondary metabolites (Konz et al., 1998; Serrato et al., 2004; Lara et al., 2006). In order to get more information about the mechanisms involved in the impact of DOT on lipase production, three steps of the lipase synthesis machinery. Firstly, the lipase gene translation (Lip2 gene code for the main lipase produced by Yarrowia lipolytica) has been evaluated by using quantitative reverse transcription polymerase chain reaction qRT-PCR. Secondly, the intracellular lipase synthesis has been investigated. For this purpose, the reporter strain Y. lipolytica JMY775 [Lgx64.81 derivative transformed with LIP2–LacZ reporter gene (Fickers et al., 2004)] was used, the amount of intracellular enzymes being measured the β-galactosidase activity. Finally, the extracellular lipase activity in the medium, linked with the lipase excretion rate, has been determined. The scheme shown at figure 1 highlights the different physiological steps investigated in this work. Different DOT fluctuation profiles have been reproduced in a scale-down apparatus designed to simulate the heterogeneous conditions experienced in large scale bioreactors where cells are exposed sequentially to aerated and non-aerated zone. The SDR used is a 20 l stirred bioreactor equipped with an automatic air admission valve controlled by a specific algorithm (Namdev et al., 1993) (Figure 2). Three DOT fluctuations profiles have been considered in order to highlight the effect of the duration and frequency of cell exposure to anaerobic conditions.
2. Materials and methods
2.1. Strain and culture conditions
2Yarrowia lipolytica JMY775 is stored at -80°C in working seeds vials (cells in suspension in glycerol solution 40%). The JMY775 strain has been obtained by genetic manipulation from a lipase overproducing strain (LgX64.81) modified with a LIP2-LacZ reporter gene. Cells are first precultivated in a 250 ml baffled shake flask containing 100 ml of YPG medium at 30°C for 22 h. A second precultivation step is then carried out during 15 h in 2 l baffled shaken flasks containing 750 ml of medium containing glucose (15 g.l-1), tryptone N1 (10 g.l-1) (BHA, Belgium), yeast extract (10 g.l-1). After the precultivation steps, the culture is transferred to a 20 l bioreactor (Biolaffite-France; internal diameter 0.22 m) with a working volume of 13 l and equipped with two RDT6 rushton turbines (d = 0.1 m). The cultivation media for the bioreactor has been optimized to be convenient for the lipase and RNAm extraction, it contains per liter: methyl oleate 30 ml (Cognis, France), tryptone N1 7.5 g and yeast extract 7.5 g. The regulation of the culture parameters (pH, temperature, etc.) is ensured by a direct control system (ABB). The culture in the bioreactor is carried out at 30°C with a fixed stirring speed of 350 rpm and an air flow rate of 0.75 vvm (volume of air per volume of medium per minute). In our case 0.75 vvm correspond to 10 l.min-1).
3The dissolved oxygen is continuously monitored with an oxygen probe (Mettler Toledo InPro 6800 series). DOT is reported as saturation percentage with a response time 2 seconds. The foam level in the reactor is monitored by an antifoam probe placed at 10 cm from top of the vessel. The foam level is then controlled by the addition of antifoam Tego KS911 (Goldschmidt, Germany). The pH of the broth is measured with a pH probe (Mettler Toledo InPro 2000/120/Pt100/9848) and is regulated at a value of 7 ± 0.1 by the addition of KOH 6 N or H3PO4 6 N.
2.2. Analytical methods
4Cell dry weight determination. Biomass yield was determined after the elimination of the fatty fraction of culture medium. Fifteen millilitres of medium were centrifuged at 10,000×g for 20 min (Avanti J-25I, Beckman, USA). The supernatant was eliminated, and the Harvested cells were washed twice with water and detergent 2%. Biomass concentration was measured by cell dry weight (CDW) which is determined by filtering 15 ml of the cellular suspension under vacuum through hydrophobic polyethersulfone filters with pore 0.45u (Pall Life Sciences, USA). The filtered biomass was put in small aluminium dishes and dried at 105°C for 24 h.
5Enzymatic activity assay. The extracellular lipase activity is determined as follows: samples of the culture medium are withdrawn at various times of fermentation, centrifuged for 20 min at 10,000 g. The supernatant is then used for the extracellular lipase activity estimation using an olive oil emulsion as the enzyme substrate [olive oil 25%, 0.1 M NaOH 7.5%, polyvinylic alcohol (2%) 67.5%]. The enzymatic reaction is initiated by adding 1 ml of supernatant to 4 ml of emulsion with 5 ml of 0.1 M of phosphate buffer at pH 7. The enzymatic reaction is maintained for 15 min at 37°C on a rotary shaker (150 rpm) and is subsequently stopped by the addition 20 ml of acetone-ethanol mix [1:1(v/v)]. The free fatty acids released during the reaction are then titrated with 0.05 M NaOH (Kar et al., 2008). One unit of lipase activity is defined as the amount of lipase inducing the release of 1 mmol of fatty acid per minute at 37°C and pH 7. The translation level of lipase RNAm is performed on the basis of the parallel synthesis ß-galactosidase by the LIP2–LacZ reporter gene JMY775 strain. The ß-galactosidase activity, expressed in Miller unit.mg-1 of dry material, Miller unit is defined as the amount of enzyme releasing 1 mol of o-nitrophenol (subsequent to the hydrolysis of the ortho-nitrophenyl-β-galactosidase ONPG) per minute and per 1 mg dry material at 37°C (we used the dry material instead of the optical density 600 nm to measure the ß-galactosidase activity to avoid the effect of the methyl oleate at the values of DO600). The ß-galactosidase is extracted from the microbial cells by a chloroform permeabilization procedure as described previously (Fickers et al., 2004).
6Extraction and purification of total RNA. A culture sample of 15 ml was filtered under vacuum through 0.45 μm pore size filters. The filters were put in a falcon and conserved directly in the liquid azote to avoid the RNAm degradation. Then, the filters were conserved at -80°C. The E.Z.N.A.TM Yeast RNA Kit (OMEGA bio-tek®) was used to extract the RNA. DNase treatment was done to RNA samples using Turbo DNA-freeTM Kit
7(Applied Biosystems) to remove the contaminating DNA from RNA preparation. RNA quality and quantification were analyzed using a GenesysTM Spectrophotometer. The cDNAs were subsequently synthesized using the High Capacity RNA-to-cDNA Kit (Applied Biosystems).
8Real-time PCR conditions. The primers for real-time PCR were designed to have a length of about 20-25 bases, a G/C content of over 50%, and a Tm of about 60ºC. The length of the PCR products ranged between 90 and 150 bp. LightCyclerTM 163 software (Roche, Mannheim, Germany) was used to select primer sequences. The sequences of the primer encode the gene of Actin ACT-R (GGCCAGCCATATCGAGTCGCA), ACT-F (TCCAGGCCGTCCTCTCCC) (Mansour et al., 2009). The sequences of the primer encode the gene of Lip2: Lip2-R (ATCTGGTAGTCGGGATACTG), Lip2-F (TTGATCTTGCTGCTAACATC). All the primers were synthesized by Eurogentec (Seraing, Belgium). The SYBR green I PCR amplification was performed using a POWER SYBR® GREEN PCR (Applied Biosystems). The Amplification was carried out in a 25 μl (final volume) mixture containing 1,000 ng of RNA sample, 0.3 μM of primer, and 12.5 μl of POWER SYBR® GREEN PCR (Applied Biosystems). A negative control without cDNA added was systematically included. Real-time PCR is performed on instrument StepOne PlusTM Real-Time PCR System (Applied Biosystems ). The experimental design is done by using the program StepOneTM Software v2.0.1 installed on a PC connected to the instrument; we used mode SYBRR Green Reagents and Quantitation - Comparative CT (ΔΔCT). The same program was used to determine the threshold cycle (CT) values. The amplification procedure involved an incubation step at 95ºC for 10 min for the initial denaturation, followed by 41 cycles consisting of:
9– denaturation at 95ºC for 15 s;
10– for 1 min;
11– after real-time PCR, a melting curve analysis was performed by continuously measuring fluorescence during heating from 60 to 95ºC at a transition rate of 0.3ºC.s-1.
12Standard curves were generated by plotting the CT values as a function of the initial RNA concentration log. PCR efficiency (E) was then calculated using the following formula: E = 10-1/slope, where as four dilution of cDNA were prepared to determine the real time PCR efficiencies. The Actin gene (Blanchin-Roland et al., 2005) was chosen as a suitable internal control gene to normalize the results. The Pffafl method (Pfaffl, 2001) was used to calculate the fold change in transcript abundance normalized to the Actin gene and relative to the sample collected at the beginning of fermentation in the fermentor (T0).
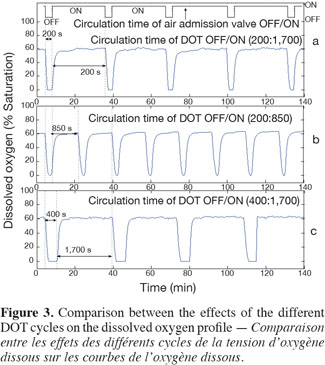
13Scale-down reactor strategies. The SDR has been designed in order to consider that the "on and off" state of the air admission valve corresponds to the cells displacement through respectively an aerated and a non-aerated fluid zone in a hypothetical industrial bioreactor. The effect of fluctuating DOT has been isolated by using this kind of SDR. It has been previously designed to specifically observe the impact of the DOT fluctuations on the microbial physiology (Namdev et al., 1991). The SDR comprises a 20 l stirred bioreactor and an air admission valve which controls the air injection (Figure 1). The oscillating DOT is generated by sequentially opening and closing the air admission valve. Therefore, the air flow rate oscillations are characterized by the DOT profiles depicted at figure 3. The control algorithm imposes regular OFF/ON cycles to the air admission valve. Three OFF/ON cycles have been assessed to determine the effect of the length and frequency of cells exposure to non-aerated medium: a (200; 1,700) profile for which air admission valve is closed for 200 s over a total cycling period of 1,900 s. On the same basis, a (400; 1,700) and a (200; 850) cycle have been considered.
3. Results and discussion
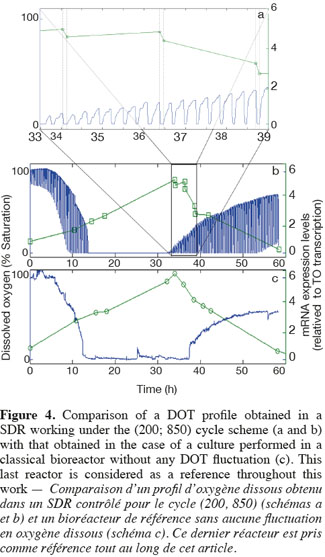
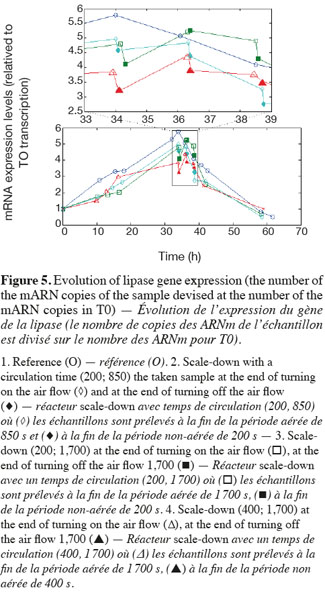
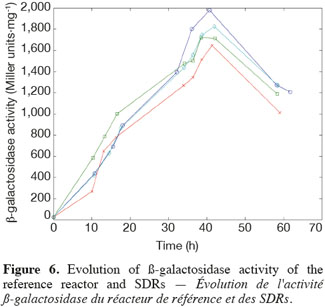
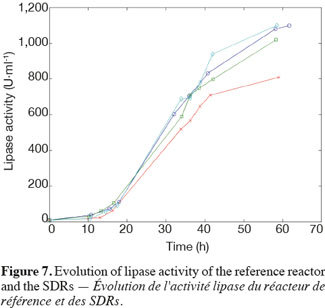
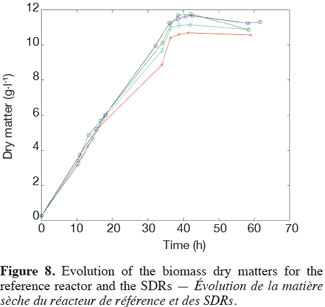
14The experiments have been performed with the SDR system in order to investigate the effects of DOT fluctuations by comparison with a reference culture, i.e. a culture carried out in a bioreactor without considering any DOT fluctuations. Figure 4 shows a typical DOT evolution for a culture conducted under a constant air flow, compared with that obtained by considering a SDR operating with the (200; 850) cycle. The effect of DOT oscillations on the amount of transcripts has been investigated by considering three different DOT cycling regimes. Among the techniques used to characterize the physiological response of Y. lipolytica, the RT-qPCR is the most powerful tool to amplify small amounts of mRNA and determine slight physiological response to fluctuating environmental conditions (Pfaffl, 2001). As seen from figure 5, the amount of lip2 mRNA for all oscillating DOT conditions decreases considerably for the samples taken during the non-aerated period of the cycle (resulting from the closure of the air admission valve by the controller). Non-aerated time intervals of 200 s were enough to observe a decrease at the level of the amount mRNA transcripts. This observation is in accordance with the time constant associated with mRNA degradation which is around 1 to 3 min. At another level, the protein translation rate has been monitored by measuring the β-galactosidase activity related to the lip2 promoter (Figure 6). The results depicted at figure 6 show that the β-galactosidase activities recorded in the case of the SDR are slightly lower than those noticed for the reference reactor. It can be observed that the protein synthesis follows the mRNA dynamics. The β-galactosidase dynamics is slower considering the higher time constants linked with protein synthesis and turnover. The final step of lipase secretion has been determined by measuring the activity of the lipase in the extracellular medium. Figure 7 shows a pronounced drop at level of extracellular lipase production in the case of the SDR conducted under the (400; 1,700) cycling regime, but no differences have been observed between the other SDR experiments and the reference. This result was expected according to the previous results obtained for the amount of mRNA and the β-galactosidase activities recorded for this reactor. As shown in figure 8, no differences can be observed between the cells growth curves obtained in SDR and in the reference bioreactor, except in the case of (400; 1,700) cycling profile, for which the cells are exposed to the longer oxygen deprivation periods. The results obtained throughout this work can be globally explained by comparing the time constant associated with the DOT cycling regimes and those associated with the different physiological responses. Indeed, the time constant associated with the DOT fluctuations is around 3 min, whereas the time constant associated with mRNA dynamics is in the order of 0.5 to 2 min, and around 10 min and 60 min for protein dynamics and cell growth respectively. It is thus logical to observed the more pronounced differences at the level of the amount of lip2 mRNA.
4. Conclusion
15In this work, a scale-down bioreactor has been used in order to simulate DOT fluctuations. The impact of DOT fluctuations on Y. lipolytica has been investigated at different levels of the lipase synthesis pathway. Three different oscillating aerobic/anaerobic profiles were preformed in the scale-down system. It has been observed that the switch from aerobic to anaerobic conditions decreases the rate of the lipase gene expression (Lip2 gene investigated by RT-PCR), even at transient exposure to anaerobic condition as short as 200 s. This effect was more pronounced when the frequency of the exposure to anaerobic conditions was increased. At a second level, i.e. depicted by measuring the β-galactosidase translational rate linked with the lip2 promoter, for the constant and oscillating DOT cultures the protein translation is not altered by the fluctuation of DOT. Finally, the activity of the extracellular lipase was similar in constant DOT and the experiments carried out with 200 s aeration off and different sequences of 850 s or 1,700 s, even if differences have been observed at the level of the amount of lip2 transcripts for the same operating conditions. The same reduction rate of the messenger RNA has been observed mainly for the experiment involving the (400; 1,700) DOT fluctuation profile, this profile representing the more severe condition for which cells are exposed to the longer oxygen deficiency period. In conclusion, no significant differences have been observed for the cell growth between the reference and the SDR bioreactors, apart from a slight decrease at the level of the lipase yield in the case of the SDR conducted with longer oxygen limiting period. The most sensitive parameter that has been linked with DOT fluctuations is the number of lip2 mRNA determined by RT-qPCR. This is not surprising since the half-life of mRNA synthesis and degradation is very low (about 10 to 100 s for synthesis and about 1 to 3 min for degradation) compared to the amplitude of the DOT fluctuations. Nevertheless, this technique is time consuming and cannot be used to perform at-line analysis of the process. A faster way to perform at-line or on-line analysis of a physiological parameter during a fermentation process is to consider the use of a reporter system, like the lacZ reporter gene considered in this work. The drawback associated with this technique is that it is based on protein accumulation inside the cell, a physiological process characterized by a time constant of a few minutes, which is higher than the time constant of most of the extracellular perturbations. Efforts must thus be done at the level of the reporter system in order to increase their sensitiveness to extracellular perturbations.
Bibliographie
Blanchin-Roland S., Costa G.D. & Gaillardin C., 2005. ESCRT-I components of the endocytic machinery are required for Rim101-dependent ambient pH regulation in the yeast Yarrowia lipolytica. Microbiology, 151(11), 3627-3637.
Fickers P. et al., 2004. Carbon and nitrogen sources modulate lipase production in the yeast Yarrowia lipolytica. J. Appl. Microbiol., 96(4), 742-749.
Jaeger K.E. et al., 1994. Bacterial lipases. FEMS Microbiol. Rev., 15(1), 29-63.
Kar T. et al., 2008. Investigation of the effect of different extracellular factors on the lipase production by Yarrowia lipolityca on the basis of a scale-down approach. J. Ind. Microbiol. Biotechnol., 35(9), 1053-1059.
Konz J.O., King J. & Cooney C.L., 1998. Effects of oxygen on recombinant protein expression. Biotechnol. Prog., 14(3), 393-409.
Lara A., Galindo E., Ramírez O. & Palomares L., 2006. Living with heterogeneities in bioreactors. Mol. Biotechnol., 34(3), 355-381.
Mansour S., Bailly J., Delettre J. & Bonnarme P., 2009. A proteomic and transcriptomic view of amino acids catabolism in the yeast Yarrowia lipolytica. Proteomics, 9(20), 4714-4725.
Namdev P.K., Yegneswaran P.K., Thompson B.G. & Gray M.R., 1991. Experimental simulation of large-scale bioreactor environments using a monte carlo method. Can. J. Chem. Eng., 69(2), 513-519.
Namdev P.K., Irwin N., Thompson B.G. & Gray M.R., 1993. Effect of oxygen fluctuations on recombinant Escherichia coli fermentation. Biotechnol. Bioeng., 41(6), 666-670.
Oosterhuis N.M.G., Kossen N.W.F., Olivier A.P.C. & Schenk E.S., 1985. Scale-down and optimization studies of the gluconic acid fermentation by Gluconobacter oxydans. Biotechnol. Bioeng., 27(5), 711-720.
Pfaffl M.W., 2001. A new mathematical model for relative quantification in real-time RT-PCR. Nucl. Acids Res., 29(9), 2002-2007.
Serrato J.A., Palomares L.A., Meneses-Acosta A. & Ramirez O.T., 2004. Heterogeneous conditions in dissolved oxygen affect N-glycosylation but not productivity of a monoclonal antibody in hybridoma cultures. Biotechnol. Bioeng., 88(2), 176-188.
Para citar este artículo
Acerca de: Tambi Kar
Univ. Liege-Gembloux Agro-Bio Tech. Walloon Center of Industrial Biology (WCIB). Bio-Industries Unit. Passage des Déportés, 2. B-5030 Gembloux (Belgium).
Acerca de: Jacqueline Destain
Univ. Liege-Gembloux Agro-Bio Tech. Walloon Center of Industrial Biology (WCIB). Bio-Industries Unit. Passage des Déportés, 2. B-5030 Gembloux (Belgium).
Acerca de: Philippe Thonart
Univ. Liege-Gembloux Agro-Bio Tech. Walloon Center of Industrial Biology (WCIB). Bio-Industries Unit. Passage des Déportés, 2. B-5030 Gembloux (Belgium).
Acerca de: Frank Delvigne
Univ. Liege-Gembloux Agro-Bio Tech. Walloon Center of Industrial Biology (WCIB). Bio-Industries Unit. Passage des Déportés, 2. B-5030 Gembloux (Belgium). E-mail: F.Delvigne@ulg.ac.be