


- Accueil
- volume 13 (2009)
- numéro spécial
- Identification by microscopy and MS-based electronic nose of a fraudulent addition to maize gluten


Visualisation(s): 2785 (17 ULiège)
Téléchargement(s): 31 (1 ULiège)

Identification by microscopy and MS-based electronic nose of a fraudulent addition to maize gluten

Abstract
Classical and chemometric methods have been used to detect falsified maize gluten products. Microscopic observations (numerous starch grains, seed envelopes and wheat bran fragments) clearly showed the presence of atypical maize gluten particles in samples with otherwise normal crude protein levels (≥ 60%) and the usual gold-yellow color. Chemical analyses in a few samples confirmed the presence of urea (19 to 174 g.kg-1), melamine (0 to 20 g.kg-1), and cyanuric acid (0 to 10 g.kg-1) coping for the low levels of methionine (0 to 13 g.kg-1) in incriminated products (genuine maize gluten methionine level ≥ 16 g.kg-1). Furthermore, a fast technique (an electronic nose based on mass spectrometry detection) also proved to be reliable for the identification of falsified maize gluten products: 100% correct classification of model and unknown samples was achieved with principal component analysis. As a consequence of these results, the Swiss feed-inspection authority blocked the import, or restricted the use, of 2,500 tons of the falsified products.
Table des matières
1. Introduction
1Maize and maize products are largely used in human and animal nutrition. The most important industries transforming maize are the distilleries and the starch producers. A by-product of these industries is maize gluten, a protein rich raw material with roughly 60% crude protein (CP), which is routinely used in ruminant and poultry feedstuffs. In ruminant feeding, its high protein rumen-bypass is particularly valued because this protein escapes degradation by rumen microbes (NRC, 1985). In poultry feeding, the high energy and methionine levels, as well as the high xanthophylls pigment content, are most valuable (Cheeke, 1999). Therefore maize gluten is an important and relatively expensive feed component which quality is readily checked by customer companies.
2For animal feeding purposes around 50,000 tons of maize gluten are yearly imported into Switzerland. In the last years over 80% of the imported maize gluten was provided by the Chinese market in order to avoid transgenic products from the USA.
3Switzerland’s official feed control authorities perform occasional sampling at the border and regular monitoring of the feed mills. Classical microscopy (CM, based on the observation of particles and structure recognition) is used routinely to check the samples for the presence of meat and bone meal (MBM) and to verify the composition of feedstuffs. The knowledge that some cases of substitution of protein by addition of N-rich organic compounds had occurred in the past (EFSA statement, 2007), led the official control unit to verify samples with abnormal abundance of starch and wheat bran as revealed by CM. Thus, the presence of possible nitrogen substitutes was suspected: urea, melamine, cyanuric acid, ammeline and ammelide. These additions could cause problems to the animals fed with these products, even if they are mixed in a compound feed. Indeed, to avoid toxicity, urea should not exceed 2% of the ruminants’ diet (Cheeke, 1999); furthermore, the diet should be adapted to this readily usable nitrogen source (Jarrige, 1988). A melamine level exceeding 12.5 mg.kg-1 of total mixed ration (88% dry matter) could be harmful (EFSA’s statement, 2007; Puschner et al., 2007).
4Once the alteration being detected, about 2,500 tons of maize gluten imported from China during spring 2007 was either destroyed or, when only urea had been added, it was used in ruminant nutrition after thorough analysis.
5The importance of careful checking the raw material entering the feed and food chain by microscopy is emphasized by this example. Furthermore, the possibility to perform a screening of the samples with an electronic nose (EN) was studied, as a faster and economical alternative to classical analytical techniques.
2. Material and methods
6Samples, declared as maize gluten, were either sent to ALP by commercial customers or collected by the Swiss authorities at the border or in the feed mills.
7Crude protein (Dumas), crude fiber (CF) (ISO 6865:2000), amino acids (HPLC), urea (enzymatic), melamine, cyanuric acid, ammelide and ammeline (GC-MS/MS) were determined.
2.1. Microscopic methods (CM)
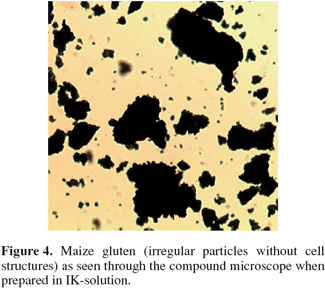
8The classical or optical microscopy method consists in the observation of the particles by means of a stereomicroscope (magnification 6.3 to 50 times) or the preparation of a particle suspension (in mounting or coloring medium) followed by the observation with the compound microscope (magnification 50 to 400 times). In the present case the best observations were made by mounting the fine particles in an iodine/potassium iodide solution (IK-solution, Frick et al., 2002), which colors starch in dark blue and protein in brown-red.
2.2. Electronic nose system (EN)
9The electronic nose system (EN) (SMart Nose SA, Marin-Epagnier, Switzerland) consists of a quadrupole mass spectrometer (Inficon SA, Switzerland), with an ionic mass range from 10 to 300 m/z (mass-to-charge ratio), fitted with a special injection device and a capillary column for gas phase transfer purposes. The SMart Nose is coupled with an autosampler COMBI PAL (CTC Analytics AG, Zwingen, Switzerland). The autosampler can be programmed to inject the headspace of individually conditioned samples from a 99 vials (10 ml) rack. The system is equipped with user-friendly software, SMart Nose 151, to perform statistical multivariate analysis.
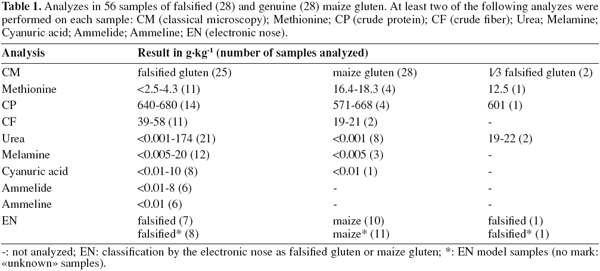
10The analysis was performed with samples as received without any further preparation. 2.0 ± 0.1 g of a sample were introduced into a 10 ml glass vial, which was then hermetically sealed with a blue silicon/Teflon septum and capped with a magnetic cap. Each vial was conditioned for 30 min at 120°C. Immediately after, the headspace was sampled with a 2.5 ml syringe heated at 130°C and transferred to the injection port of the SMart Nose heated at 200°C. Data was acquired at 55 eV, from 10 to 150 m/z, at 0.2 sec/m/z, for 6 min. After each injection the entire system was purged with a N2 flow rate of 260 Sml per min during 2 min. Each sample was analyzed in triplicate; a blank was run every 10 injections. Raw data was normalized by the intensity of the ionic fragment 40 amu to correct for possible drift. Principal component analysis (PCA) was performed using 20 “model” samples (11 maize gluten and 9 falsified gluten samples). Additional 18 “unknown” samples (10 maize gluten and 8 falsified gluten samples) were analyzed and classified using the PCA pre-established models. The reference classification was performed via classical analytical methods, i.e. microscopic and chemical analysis (Table 1).

3. Results
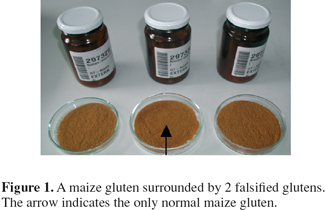
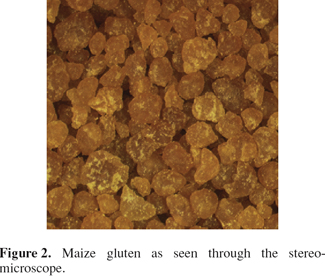
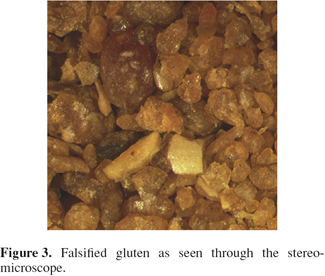
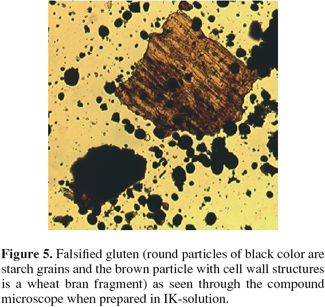
11Some samples routinely checked for MBM contamination presented large amounts of starch and wheat bran in products declared as maize gluten. The aspect of genuine and falsified maize gluten products is quite similar when inspected visually (Figure 1) or through a stereomicroscope at a magnification of 6.3 (Figures 2 and 3). Only the preparations for the compound microscope (Figures 4 and 5, magnification at least 50 times) reveal the differences in structure: irregular particles without cell structures of maize gluten (Figure 4), and round dark blue to black particles, typical for starch grains, together with brownish particles with cell wall structures typical for wheat bran of falsified gluten (Figure 5).
12The samples were further analyzed to confirm the CM findings, for at least one more parameter (Table 1): methionine, CP, CF, urea, melamine, cyanuric acid, ammelide, ammeline. The eleven chemically analyzed falsified gluten samples did not show methionine with one exception (4.3 g.kg-1). The expected methionine content (16.4 to 18.3 g.kg-1) was verified in all genuine gluten samples chemically analyzed. The CP content (around 650 g.kg-1) showed no significant difference between falsified and genuine maize gluten samples. The two maize gluten samples analyzed for CF gave expected values, 19 and 21 g.kg-1. The eleven falsified samples showed CF values of about 50 g.kg-1 in accordance with the CM observation of significant amounts of wheat bran. As expected, no urea was found in the 8 maize gluten analyzed samples whereas 13 falsified samples contained between 121 and 174 g.kg-1 of urea. Three other falsified samples showing > 44 g.kg-1 of urea happened to contain other N-rich compounds as well: cyanuric acid (2 to 10 g.kg-1) and/or ammelide (4 to 8 g.kg-1). Four further falsified samples containing between undetectable to 82 g.kg-1 of urea were not further analyzed for other N-rich compounds, however, either their CF content was too high, 41 to 44 g.kg-1, or no methionine was detected confirming the abnormality of these products. The microscopic examination of 2 samples showed partially falsified maize gluten products. Indeed their urea content was low (19 and 22 g.kg-1) but not zero. Furthermore 1 sample showed a methionine content of 12.5 g.kg-1 which corresponds to about 3/4 of the normal content. According to the official feed inspection unit, falsified samples had been arriving to Switzerland during a period of six months at least. This probably explains the heterogeneity of the urea content in the falsified samples.
13Two other analyses performed at ALP in some samples (results not shown) corroborate the preceding findings: about 3 times more starch (polarographic method) and wheat genetic material (DNA) were detected in falsified samples.
14Electronic nose
15A PCA model was developed using a group of reference samples, designated by solid symbols in figure 6. This PCA model indicated a 100% correct classification of maize gluten and falsified gluten samples. Furthermore, a set of unknown samples, designated by open symbols in figure 6, were 100% correctly classified by the pre-established model into either maize gluten or falsified gluten classes. The assignment of a sample to a given class is determined by the shortest Euclidean distance among the Euclidean distances between the sample and the different available classes. About 93% of the total variance of the set of model samples is explained by PCs 1 and 2, the differentiation between maize and falsified gluten samples being mainly characterized by PC 2. PC 1 explains about 65% of the inherent variance, which mostly characterizes differences in the maize gluten class; probably different contents in methionine, threonine, leucine and lysine.
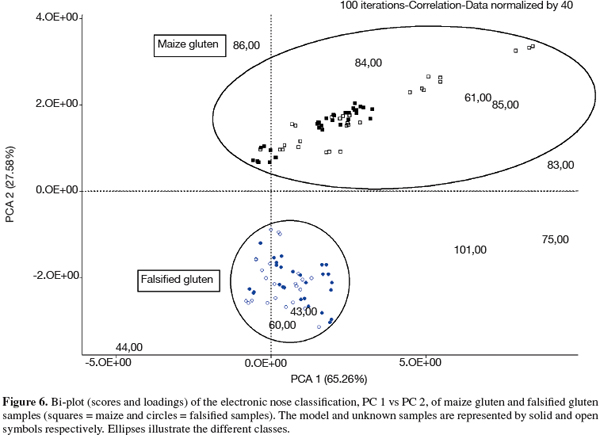
16From the two samples identified by classical means as 1/3 falsified gluten, one was included in the model set. Both samples were classified by the EN as falsified gluten; however, within the falsified class they appear closest to the maize gluten class.
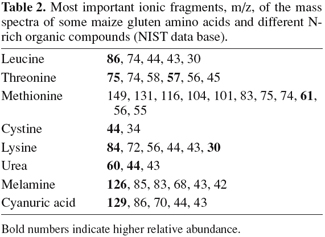
17The loadings of the PCA model, visible in figure 6, show that the maize class is characterized by ionic fragments 86 (leucine), 84 (lysine), 61 (methionine) and 85 m/z (Table 2) whereas the falsified gluten class is characterized by ionic fragments 60 and 44 (urea) and 43 m/z (melamine). Accordingly, chemical analyses showed the presence of urea, sometimes accompanied by melamine and cyanuric acid (Table 1) in falsified gluten samples. On the other hand, the analyzed maize gluten samples showed methionine as expected (between 16 and 18 g.kg-1), but no urea, melamine or cyanuric acid. The ionic fragments 101, 75 and 83 m/z (Figure 6) are present in the mass spectra of methionine and/or threonine. They seem to correlate with a different characteristic of the samples (perpendicular axis) than the differentiation between maize gluten and falsified gluten. Indeed, their coefficients in PC 2 are low as compared to the coefficients of the other fragments, whereas they are the highest in PC 1 (data not shown). Although the ionic fragments 86, 85 and 44, 43 m/z are also present in the mass spectra of the corresponding antagonist substances (cyanuric acid, melamine and leucine, cystine, lysine respectively), their relative abundance is very low (Table 2).
18The principle of the present method is to analyze the gas phase without separation into individual components (Ampuero et al., 2003). The mass spectrum obtained represents a sort of a fingerprint of the sample. Indeed the discriminating ionic fragments of the model can originate from every substance present in the gas phase; however, the parallel chemical analyses bring evidence for the identification of the main substances responsible for the discrimination. Thus the strength of this method is to operate the classification of samples based on the global detection of fragments of the different relevant substances with a simple and fast technique.
4. Conclusion
19The results presented here show that the incriminated products had been purposely manipulated to resemble maize gluten in order to cheat the customers. Thus the appearance of these products was similar to the one of maize gluten as the particles had the same color and size. Furthermore their crude protein content could not be distinguished from the one in normal products. Indeed N-rich compounds had been added in a way to reach a maize gluten CP value of about 650 g.kg-1.
20While microscopic examinations gave the alarm, only thorough examinations and time-consuming analyses unveiled the fraud. The electronic nose technique proved to be a reliable method for the detection of falsified gluten samples, basing the discrimination on global information related to the most relevant substances, i.e. gluten amino acids like leucine, methionine, threonine, etc. and other N-rich organic compounds like urea, melamine and cyanuric acid. Besides being a reliable and fast technique (6 min per injection), a big advantage of this method is that there is no need for sample preparation.
21Most of the falsified gluten studied here should not be mixed in a feed for ruminant at more than 10% in order to avoid toxicity. The high levels of melamine found in some samples (up to 20 g.kg-1) resulting in circa 400 mg of melamine per kg of total mixed ration obviously prevent the use of these products in the feed chain. These observations emphasize the need for quick and efficient methods to screen samples of raw materials such as industrial by-products.
Bibliographie
Ampuero S. & Bosset J.O., 2003. The electronic nose applied to dairy products: a review. Sens. Actuators B, 94, 1-12.
Cheeke P.R., 1999. Applied Animal Nutrition. 2nd ed. Upper Saddle River, NJ, USA: Prentice Hall.
EFSA, 2007. EFSA’s Provisional statement on a request from the European Commission related to melamine and structurally related compounds such as cyanuric acid in protein-rich ingredients used for feed and food. Question n°EFSA-Q-2007-093, 08.06.07.
Frick G., Roetschi A. & Hauswirth H., 2002. Mikroskopische Untersuchung von Futtermitteln. Agrarforschung, 9, 497-504.
Jarrige R., 1988. Alimentation des bovins, ovins et caprins. Paris : INRA.
NRC (National Research Council), 1985. Ruminant nitrogen usage. Washington, DC, USA: National Academy Press.
Puschner B. et al., 2007. Assessment of melamine and cyanuric acid toxicity in cats. J. Vet. Diagn. Invest., 19(6), 616-624.
Pour citer cet article
A propos de : Geneviève Frick
Agroscope Liebefeld-Posieux. Research Station ALP. Federal Department of Economic Affairs (FDEA). Tioleyre, 4. CH-1725 Posieux (Switzerland). E-mail: Genevieve.Frick@alp.admin.ch
A propos de : Sébastien Dubois
Agroscope Liebefeld-Posieux. Research Station ALP. Federal Department of Economic Affairs (FDEA). Tioleyre, 4. CH-1725 Posieux (Switzerland).
A propos de : Claude Chaubert
Agroscope Liebefeld-Posieux. Research Station ALP. Federal Department of Economic Affairs (FDEA). Tioleyre, 4. CH-1725 Posieux (Switzerland).
A propos de : Silvia Ampuero
Agroscope Liebefeld-Posieux. Research Station ALP. Federal Department of Economic Affairs (FDEA). Tioleyre, 4. CH-1725 Posieux (Switzerland).