


- Accueil
- volume 13 (2009)
- numéro spécial
- Combining microscopic methods and computer image analysis for lacunae morpho-metric measurements in poultry and mammal by-products characterization


Visualisation(s): 1464 (2 ULiège)
Téléchargement(s): 33 (1 ULiège)

Combining microscopic methods and computer image analysis for lacunae morpho-metric measurements in poultry and mammal by-products characterization

Abstract
The aim of this study was to evaluate the potential of image analysis measurements in combination with the official analytical method (Commission directive 2003/126/EC) for the detection of constituents of animal origin in feedstuffs, in distinguishing between land animals (i.e. poultry vs mammals). Results obtained in the present study indicated that even though most of the variables measured were significantly different between mammalian and poultry in terms of mean, only a few can be used in distinguishing avian vs mammalian material. In conclusion, data presented indicate that some of the variables/descriptors provided by image analysis related to lacunae dimensions and features appear promising for a reliable distinction between animal meal at the level of vertebrate classes, while for further characterization, at higher taxonomic level, contribution of morphological variables deserves further investigation.
1. Introduction
1To enforce Regulation 2002/1774/EC, reliable analytical methods that identify the species of provenance of animal material are necessary. As reported elsewhere (Gizzi et al., 2003; van Raamsdonk et al., 2004; 2007) the official microscopic method for determining processed animal proteins in feedstuffs has its strengths [limit of detection (LOD) up to 0.01% meat-and-bone meal (MBM) in feeds, able to distinguish fish from land animal material, etc.] and limitations [essentially based on the presence of bone fragments, costly (instruments and work time), requires experienced analysts, etc.]. Most of the characteristics provided and used for terrestrial MBM materials identification are based on the examination of authentic samples of controlled origin and processing, and fit the information from histological textbooks and literature on animal meal (Gizzi et al., 2003). However when species identification is required, the microscopic method reveals additional limitations; in fact differences between poultry and mammal meals are more difficult to detect since bones and muscles characteristics may overlap. For instance according to type (long vs flat bones) and portion of bones analyzed (diaphysis, epiphyses) histological features of terrestrial MBM material can be very similar, presenting deviating information. In light of this a further development of the official reference method is therefore required. The computer image analysis procedure consists of a sequence of steps (Pinotti, 2009) with the aim of capturing the important structural features of a digital image (of the sample under the microscope, in this case) on which to perform morpho-metric measurements (i.e. numeric descriptors). This approach aims to add some numeric values that can be used at least in terrestrial animal class identification.
2In this field, previous studies (Pinotti et al., 2004; 2007b) indicated that the use of microscopic methods in association with computer image analysis to identify the source of these feedstuff contaminants may have some potential, particularly in distinguishing between poultry and mammalian particles, that remain one of the main difficulties in the official methods. Starting from this assumption, the aim of this study was to evaluate the potential of image analysis measurements in combination with the official analytical method for the detection of constituents of animal origin in feedstuffs, in distinguishing between land animals (i.e. poultry vs mammals).
2. Material and methods
3For this study, authentic samples of controlled origin and processing (baked at 200°C per 1 h) containing poultry (AV) or mammalian (MAM) meat and bone meals (Agricultural Research Centre of Gembloux, Belgium and SAFEED-PAP Project; VSA, University of Milan, Italy) were used. Samples were prepared from different carcass regions including legs, chest, arms (wings in the case of poultry), treated with NaOH, then heated in vacuo oven at 130°C at 1 bar for 1 h. Obtained dried samples were milled and analyzed by the microscopic method [the microscopic examination technique as described in Commission Directive 2003/126/EC of 23 December 2003 (OJ L 339, 24.12.2003, 78)]. Sediment fractions of each sample were observed with a compound microscope (Olympus BX41, Germany) at several magnifications. Through a digital camera and image analysis software (Image-for Plus 4.5.1, Media Cybernetics Inc., Silver Springs, USA), we obtained 823 bone fragment lacunae images at X40. Images have been obtained according to Pinotti et al. (2007a). Following this, the images were processed and elaborated in order to obtain, for each lacuna, a monochrome mask. On this latter 26 geometric variables were measured (823 lacunae x 26 measurement = 21,398 observations). In particular the following measurements were obtained: area, aspect (ratio between major axis and minor axis of ellipse equivalent to object), area/box (ratio between area of object and area of its bounding box), box X/Y (ratio between width and height of object’s bounding box), major axis, minor axis, diameter max, diameter min, mean diameter, radius max, radius min, perimeter, radius ratio, roundness, caliper length (along major axis), caliper width (along minor axis), perimeter 2 (chain code length of the outline), convex perimeter (perimeter of the convex outline of the object), perimeter of the equivalent ellipse, polygon area (area included in the polygon defining the object's outline), width of bounding polygon, length of bounding polygon, caliper min, caliper max, and mean caliper.
4Data obtained were analyzed by ANOVA (GLM procedure) and by PROC BOXPLOT procedure of SAS statistic software (SAS Institute, 1999). In order to show the variability of the most discriminant variables we have performed graphic test (box-plot) for mean and median comparisons.
3. Results and discussion
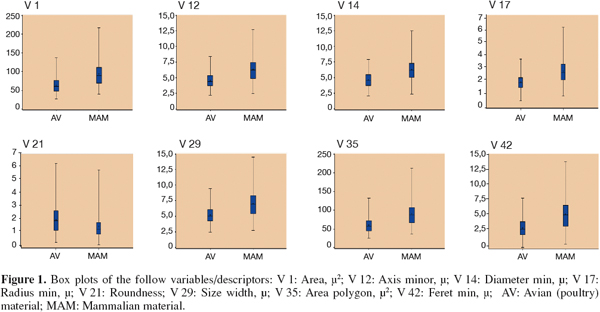
5Results obtained in the present study indicated that of 26 variables/descriptors measured on each lacuna, 23 were significantly (P<.001) different between mammalian and poultry in terms of overall mean (data not presented). In contrast box X/Y, perimeter ratio, and box width did not differ between poultry and mammals. However, in order to detect the most discriminant variables, graphic test (box-plot) for mean and median comparisons has been performed. Overall means for both animal classes for the eight best discriminant variables/descriptors are reported in table 1, while box-plots of means and medians are presented in figure 1. As reported in both table 1 and figure 1, all variables/descriptors values measured in mammalian have been higher than in poultry, except for roundness.
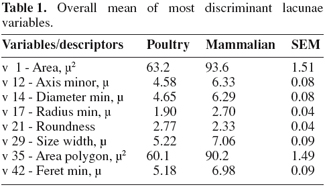
6Therefore, results obtained in the present study indicated that even though most of variables measured were significantly different between mammalian and poultry in terms of overall mean, only area, axis minor, area polygon, diameter min, feret min, radius min, roundness, and size width, can produce a discrimination among class (i.e. poultry vs mammals). Values for all variables/descriptors measured in mammalian resulted higher (+ 40% as over mean of different descriptors measured) than in poultry, except for roundness. Therefore, data herein presented indicate that not only lacunae in mammalian are in general bigger than in poultry but also that lacunae in this animal class (poultry) had a tapering shape. This is in accordance with another study (Pinotti et al., 2007b), in which similar shape descriptors, namely aspect and minor axis were respectively higher and lower in poultry indicating that poultry lacunae were not as globular as previously reported (Gizzi et al., 2003).
7Furthermore, variables graphic test (box-plot) for mean and median comparisons reveal that also using these descriptors, poultry and mammalian particles remain difficult to detect and their characteristics may often overlap. In conclusion, data here presented indicate that some of the variables/descriptors provided by image analysis related to lacunae dimensions and features appear promising in achieving reliable distinction between animal meal at the level of vertebrate classes, while for further characterization, at higher taxonomic level, contribution of morphological variables requires further investigation.
8Acknowledgements
9This work is funded by the European Commission, within the framework of the FOOD-CT-2006-036221 Project SAFEED-PAP ("Detection of presence of species-specific processed animal proteins in animal feed"; http://safeedpap.feedsafety.org) under the specific FP6 research and technological development program "Integrating and strengthening the European Research Area".
10The information contained in this work reflects the authors’ views; the European Commission is not liable for any use of the information contained therein.
Bibliographie
Gizzi G. et al., 2003. An overview of tests for animal tissues in feeds applied in response to public health concerns regarding bovine spongiform encephalopathy. Rev. Sci. Tech. Off. Int. Epizoot., 22(1), 311-331.
Pinotti L. et al., 2004. Microscopic method in processed animal proteins identification in feed: applications of image analysis. Biotechnol. Agron. Soc. Environ., 8(4), 249-251.
Pinotti L. et al., 2007a. Analisi d’immagine applicata alla tecnica microscopica classica nella caratterizzazione delle farine animali. Atti Soc. Ital. Sci. Vet., 61, 449-450.
Pinotti L. et al., 2007b. Selection of new markers for animal by-products characterization by classical microscopy. Ital. J. Anim. Sci., 6(Suppl.1), 339-341.
Pinotti L., 2009. Image analysis and microscopy: a useful combination. Biotechnol. Agron. Soc. Environ., 13(S), 21-24.
SAS Institute, 1999. SAS/STAT User’s Guide, Version 8. Cary, NC, USA: SAS Institute.
van Raamsdonk L.W.D. et al., 2004. The microscopic detection of animal proteins in feeds. Biotechnol. Agron. Soc. Environ., 8(4), 241-247.
van Raamsdonk L.W.D. et al., 2007. New developments in the detection and identification of processed animal proteins in feeds. Anim. Feed Sci. Technol., 133, 63-83.
Pour citer cet article
A propos de : Anna Campagnoli
University of Milan. Department of Veterinary Science and Technology for Food Safety. Veterinary Faculty. Via Celoria, 10. I-20133 Milano (Italy).
A propos de : Claudia Paltanin
University of Milan. Department of Veterinary Science and Technology for Food Safety. Veterinary Faculty. Via Celoria, 10. I-20133 Milano (Italy).
A propos de : Giovanni Savoini
University of Milan. Department of Veterinary Science and Technology for Food Safety. Veterinary Faculty. Via Celoria, 10. I-20133 Milano (Italy).
A propos de : Antonella Baldi
University of Milan. Department of Veterinary Science and Technology for Food Safety. Veterinary Faculty. Via Celoria, 10. I-20133 Milano (Italy).
A propos de : Luciano Pinotti
University of Milan. Department of Veterinary Science and Technology for Food Safety. Veterinary Faculty. Via Celoria, 10. I-20133 Milano (Italy). E-mail: luciano.pinotti@unimi.it