


- Accueil
- Volume 20 (2016)
- Numéro spécial 1 : AgricultureIsLife
- Indicators of phosphorus status in soils: significance and relevance for crop soils in southern Belgium. A review


Visualisation(s): 3602 (39 ULiège)
Téléchargement(s): 604 (8 ULiège)

Indicators of phosphorus status in soils: significance and relevance for crop soils in southern Belgium. A review

Notes de la rédaction
Received on April 3, 2015; accepted on February 19, 2016
Résumé
Indicateurs de l’état du phosphore : signification et pertinence dans les sols agricoles en Wallonie (synthèse bibliographique)
Introduction. Le phosphore (P) est un élément essentiel pour la croissance des plantes dont il est nécessaire de connaitre précisément la teneur dans le sol. Cela passe inévitablement par l’utilisation d’indicateurs adéquats.
Littérature. Cet article présente une revue bibliographique des indicateurs du P contenu dans les sols. Dans la littérature, il existe une multitude d’indicateurs de l’état du P dans le sol. On retrouve notamment différentes extractions chimiques (P soluble, disponible ou total) qui sont les indicateurs les plus utilisés dans le monde. Au fil du temps, des méthodes plus complexes ont été développées telles les extractions séquentielles qui caractérisent les différentes formes du P dans le sol, le taux de saturation en P, les résines échangeuses d’anions, les extractions biologiques, les méthodes isotopiques ou certains modèles plus complexes. Pour faire un choix parmi ces différents indicateurs, différents critères doivent être pris en compte dont la pertinence, le cout et le temps d’analyse, la facilité d’interprétation mais surtout l’objectif de l’indicateur. Il est également nécessaire d’évaluer l’adéquation avec le sol et le climat. Premièrement, les différents types d’indicateurs du P retrouvés dans la littérature ont été décrits et une classification a été proposée. Ensuite, les différents indicateurs ont été évalués et comparés entre eux. Enfin, la situation en Région wallonne a été discutée.
Conclusions. Tous les indicateurs du P présentent des avantages mais également des inconvénients. Cette revue bibliographique souligne l’importance de bien réfléchir au choix des indicateurs et de disposer de seuils d’interprétation correspondant.
Abstract
Introduction. Phosphorus (P) is an essential element for plant growth. Therefore, it is essential to accurately evaluate its content in the soil. This requires reliable indicators of soil P status.
Literature. This paper reviews literature regarding the indicators of P status in soils. Many indicators can be found, including single extractions (soluble, available, or total P), which are the most common indicators used worldwide. Over time, increasingly complex P indicators have been developed as sequential extractions which characterize the various forms of P, degree of P saturation, diffusive gradients in thin films, biological extractions, isotopic methods, or more complex models. To make a choice among them, different criteria should be applied, including relevance, cost and time, ease of interpretation, and, most importantly, the objective of the analysis. It is also necessary to analyze the appropriateness to soil and climate. Firstly, this paper describes the various types of indicators present in the literature, and proposes a classification system. Secondly, all cited indicators are evaluated and compared. Finally, the P indicators met in Wallonia, southern Belgium are discussed.
Conclusions. Each P indicator presents advantages and disadvantages. This review highlights the importance of careful consideration of indicator choice, and the establishment of interpretation thresholds.
Table des matières
1. Introduction
1Phosphorus (P) is an essential nutrient for plant growth, and is therefore a critical part of the fertilization requirements for crop production. However, excessive bioavailable P inputs can lead to the eutrophication of surface waters, which represents a major concern in the world. Increasing environmental issues and rise in fertilizer prices have led to the reconsideration of certain agricultural practices. According to the National Union of French Fertilizer Industries (UNIFA; www.unifa.fr), the consumption of phosphate mineral fertilizer has decreased by nearly 80% over the past 30 years. This decline threatens the availability of P in soils over the long term, and increases the risk of P deficiency in the most sensitive soils. Thus, the identification of soil deficiency risk, concomitant with the minimization of environmental losses by erosion and run-off, requires the development of relevant indicators of P status in soils.
2In soil, total P can be separated into different pools of organic and inorganic fractions. Inorganic P includes primary P minerals (apatite, strengite, variscite); secondary P minerals (Ca, Mg, Fe or Al phosphates); P adsorbed onto the edges of clay minerals; P bound to organic matter through metallic cations; and dissolved P (H2PO4-, HPO42-, PO43-). Dissolved P represents more than 96% of the P taken up by plants according to Beck et al. (1994) and can be considered as the P form directly available to plants, the quantity depending on the time of ions exchange (Fardeau, 1993). The mobility and bioavailability are controlled by the low levels of dissolved P in soil solution, which is mainly governed by high rates of adsorption and/or precipitation of dissolved P with positively charged soil compounds, including metal cations (Ca, Mg, Fe, Al) and Fe-, Al-oxyhydroxide (Hinsinger, 2001). So, P ions concentration in soil solution is therefore largely controlled by cationic activity in soil solution, which is influenced by soil pH and environmental factors as redox potential and mineral solubility (Pierzynski et al., 2005). However, P estimated available for plants can highly differ from P really taken off by crops because it depends on plant species and soil conditions.
3Organic fraction is defined as P bound with C (organic matter and biological compounds such as DNA and phospholipids) (Condron et al., 2005). The proportion of this fraction depends on factors such as land use and pedo-climatic conditions, and can vary from 25-30% to 75-80% of total P (Fardeau et al., 1994). Soil P flows occur between organic and inorganic pools via immobilization and mineralization processes mediated largely by soil microorganism activity (Oberson et al., 1996). Soil conditions, including soil moisture, temperature, pH, and surface chemical properties are integral factors promoting these reactions.
4Due to the profusion of existing indicators, it can be difficult to identify the most appropriate indicator for a given set of conditions. The management of a given environment requires indicators which are adapted to local conditions, indicators which are easy to measure, and indicators with known thresholds and limitations. It is not the purpose of this article to provide an exhaustive list of existing methods that currently serve to indicate P status in soil. Rather, the goal of this study is to evaluate the most common types of methods in order to highlight the advantages and limitations of each. This evaluation was also applied more specifically in Wallonia, a region situated in southern Belgium, though results can be extrapolated to facilitate both agronomic and environmental management of P in other regions, provided that the specific edaphic properties of a given region are considered.
2. Main method classes for P characterization in soil
5Many diagnostic tools have been developed to evaluate soil fertility. According to the literature, the available tools are based on the following variables:
6– the objective (agronomic, environmental, or both);
7– the scale of the study (e.g., a cultivated field or watershed), or
8– the measurement principle.
9These classifications are described in the following sections and in figure 1.
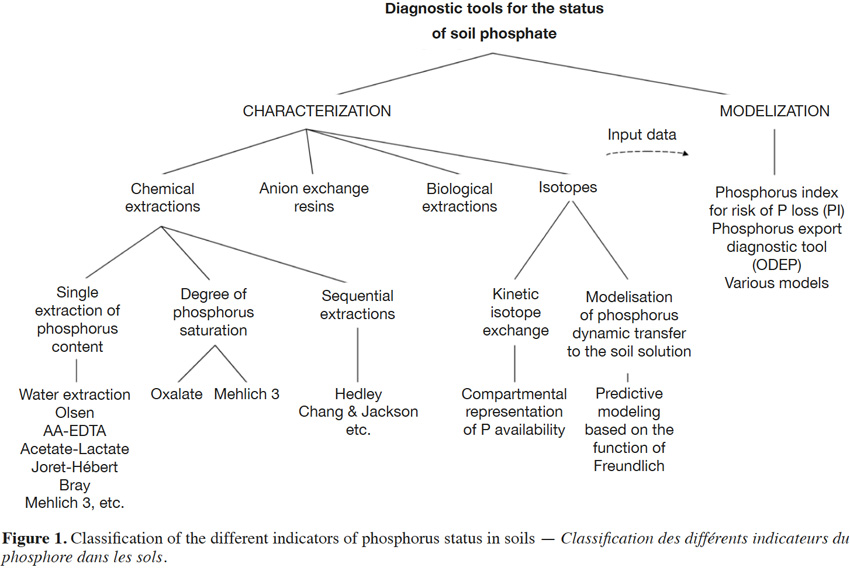
2.1. Chemical extractions
10Various chemical methods have been developed to estimate the capacity of a soil to provide the levels of P necessary for plant growth. Currently, several dozen methods exist, with varying degrees of complexity. Most of these methods were developed under specific conditions (soil or cultivation system), and were fixed with respect to interpretation references. Consequently, it is difficult to apply a uniform method worldwide, despite regulatory efforts within Europe for the establishment of a standardized set of methods (Proix, 2013). Therefore, defining specific thresholds becomes important.
11Single extractions of P content. Main existing indicators estimate the levels of available (or exchangeable) P based on “the sum of P immediately available to plants and of P that can be converted into an available form through physical (desorption), chemical (dissolution), or biological (enzymatic degradation) processes in nature during a growing season” (Boström et al., 1988). Some analytical methods utilize extractants to mimic the action of roots through dissolution, desorption, or chelation reactions. Of the several dozen chemical extraction methods reported in literature, these differ depending on the extractant used, the extraction time, and the ratio of soil to extractant. Some extraction methods are also specific to a country or region, while other methods are more universal (e.g., the methods of Olsen, Mehlich 3, or Bray; see table1). Within the same country, several methods can also coexist. This is particularly evident in France, where levels of available P are commonly evaluated according to the methods of Olsen, Joret-Hébert, and Dyer (Table 1), explained partly by diversity of soils.
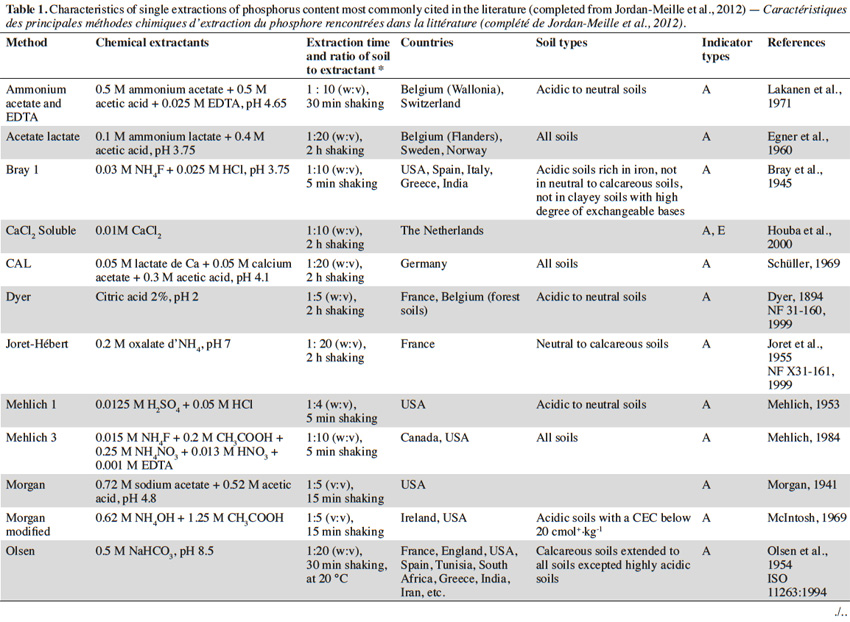
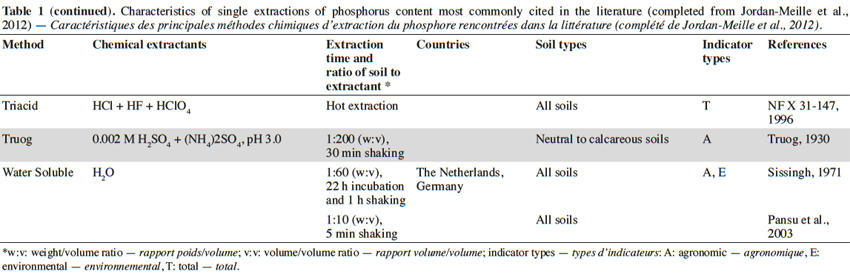
12Rather than providing an exhaustive survey of the existing methods, the following discussion will be limited to the most commonly cited methods in the literature (Table 1). Proix (2013) proposed that extraction methods can be classified into four types (I–IV), depending on which soil binding mode is affected by the extraction performed (Table 2).
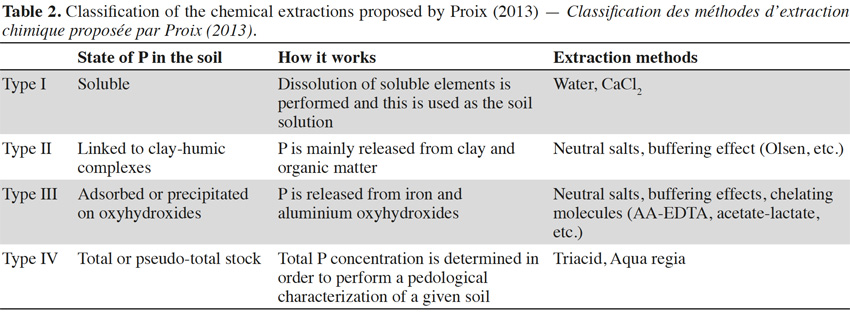
13Type I analysis methods that detect soluble P are not commonly used as agronomical indicators. Instead, these are routinely used as environmental indicators in some countries. To formulate the risk of P loss, P is extracted with distilled water (Sissingh, 1971). This method is used in The Netherlands, Austria, and Switzerland, among others; it estimates the amount of P present in the soil solution, similar to the extraction of P with 0.01 M CaCl2. The latter is generally characterized by values which are typically 2 to 3 times smaller than the former. Generally, calcium is the first cation to form complexes in soil, and thus, 0.01 M CaCl2 typically represents the average ionic strength of a soil solution (Houba et al., 2000). Levels of soluble P may also vary according to season, with levels of extracted soluble P being higher during the wetter periods than the dryer periods, which is due to the extent of mineralisation.
14Type II and III indicators correspond with the levels of available (or exchangeable) P. These are agricultural indicators which are commonly used worldwide. The methods vary, and can be customized for different action processes. For example, the Olsen method extracts P by ligand exchange, whereas the Bray method extracts P by forming complexes with calcium or aluminium phosphates (Hons et al., 1990). Therefore, some methods are more suitable for acidic soils, while others are more suitable for calcareous soils (Table 1).
15The properties of a soil can influence the results obtained from chemical extraction methods, in particular, clay, organic matter, or pH (Tran et al., 1985). Moreover, the presence of carbonates can influence the extraction capacity of the Bray method, and the presence of clay can disrupt the filtration phase of a water extraction. Extraction methods which use ammonium acetate and ethylenediaminetetraacetic acid (EDTA) are also affected by pH (Lakanen et al., 1971). Few correlations with yield have been observed for the extraction of P via the latter method in calcareous soils, since the mechanisms of P extraction are not suitable in these soils. In contrast, these different properties have only a negligible influence on the uptake of P by plants (Beaudin, 2006).
16Although it is difficult to compare the various methods of P extraction, many authors have attempted to do so (Homsy, 1992; Pote et al., 1999; Hooda et al., 2000; Maguire et al., 2002; Neyroud et al., 2003). Consequently, some authors have proposed a classification of extractants based on the amount of P that is extracted (Hons et al., 1990; Neyroud et al., 2003). However, these classifications are not universal for all types of soil. Thus, it is essential to account for the specifics of an analytical method prior to selecting it as an indicator. In addition, it is occasionally difficult to choose one unique method due to differences in the edaphic properties of a country or region. A more robust method can potentially be applied to a wide range of soils, such as Mehlich 3 in Quebec (Beaudin, 2006) or the Olsen method. Interestingly, the latter method was developed in calcareous soils, while the results of this methodology are also satisfactory in acidic soils (Morel et al., 2000).
17Finally, total P content (type IV) is occasionally used as an indicator of the P reserve present in soil. Various acid methods exist and consist of using acids such as HF, HClO4, HNO3, HCl, or H2SO4 separately or in combination, with variable efficiency. This indicator may be useful in evaluating the P content of sediment lost by erosion, or in assessing the pedological characterization of a given soil. Recently, total P content was used to estimate P reserves bound to parent materials in Wallonia (Renneson et al., 2013).
18Sequential extractions. Complementary to the approach of estimating available P, some authors have developed sequential extraction methods to identify P pools of varying solubility in soil. Different extraction methods are combined sequentially in order to deplete a soil of its content from decreasingly available fractions. Residual P is determined by the difference of P forms compared to total P.
19Many protocols for sequential extraction have been proposed (Table 3), and two major types have been distinguished. One major type involves classification on the basis of the type of bonding, while the other involves classifications on the basis of the degree of availability to plants. The most commonly used protocols were originally developed by Chang et al. (1957) and Hedley et al. (1982). The original purpose of the former work was to distinguish different forms of P depending on the type of bonding to soil minerals (e.g., P bound to iron vs aluminium vs calcium, etc.). However, the selectivity of the extractant in this protocol was often questioned. Fractionation schemes are unable to isolate discrete mineral, as they solubilize groups of minerals usually defined as P associated with Al, Fe, Ca, or residual forms (Pierzynski et al., 2005). Nevertheless, this protocol led to the development of a second type of protocols. In particular, Hedley et al. (1982) incorporated the consideration of P availability for plants, without specifying the forms of bonding within each fraction, thereby assuming the same chemical form is present in different fractions.
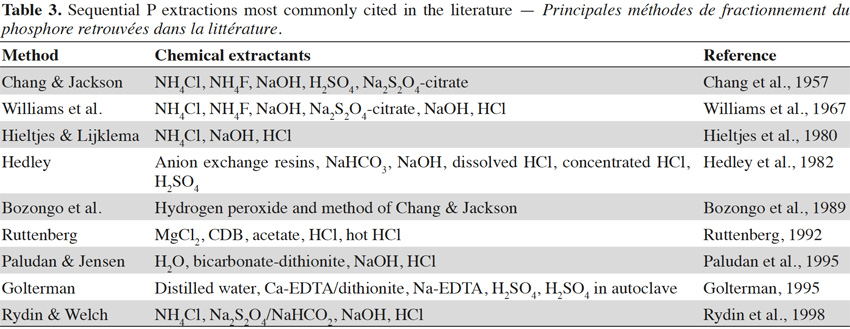
20Many studies have attempted to compare a variety of extraction methods using the same set of soil samples (Levy et al., 1999; Taoufik et al., 2004). However, the results are difficult to generalize due to the influence of soil types. Williams et al. (1967) demonstrated that the method outlined by Chang et al. (1957) was not applicable for calcareous soils or sediments. According to Tiessen et al. (1993), the fractionation of Hedley et al. (1982) is the only method that can be used with moderate success for the evaluation of available organic P. In acid soils, some pools are not completely separated (bicarbonate and hydroxide-extractable Pi) and represent a continuum of Fe- and Al-associated P extractable (Tiessen et al., 1993). The Hedley fractionation is also used in tropical soils, following protocol modifications (use of resin P fraction and generally less P fractions) (Negassa et al., 2009).
21Overall, while these methods provide an extensive characterization of the different forms of P present in a soil, they are expensive and time consuming to implement, thereby preventing their routine use.
22Degree of P saturation. Given the importance of the environmental issues related to P, and the influence of edaphic properties on the results of chemical extractions, an environmental indicator which accounts for the distinguishing characteristics of a particular soil was developed. This indicator evaluates the degree of soil P saturation by measuring the proportion of potential binding sites in soil which are actually occupied by P, with main binding sites involving the oxide and hydroxide groups of iron and aluminium (van der Zee et al., 1988). Thus, the indicator accounts for both the binding capacity and the fixed P content of the soil. Leinweber et al. (1999) have demonstrated that this parameter can be calculated according to the following equation:
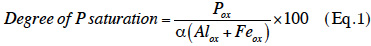
23where the degree of P saturation is expressed as a percentage, and Pox, Alox, and Feox represent the amounts of P, aluminium (Al), and iron (Fe) that are extracted with ammonium oxalate (mmol·kg-1), respectively, while α represents a scaling factor (generally 0.5).
24This method was originally developed in the acidic sandy soils of The Netherlands, and since has been applied to other regions and countries (e.g., Flanders [northern Belgium], Quebec, etc.). In Quebec, this indicator has been defined as the ratio between P and Al, as determined by the Mehlich 3 extraction (Khiari et al., 2000). In 1999, Beauchemin et al. identified the various formulas that had been used to calculate the degree of P saturation in the literature. In a study conducted in Wallonia (Renneson et al., 2015), it was demonstrated that the equation has first to be adapted to the pedological and geological context of the soil under investigation.
25Moreover, it was shown that the degree of P saturation is correlated with the concentrations of P present in run-off (Pote et al., 1999) and in drainage water (Leinweber et al., 1999), thereby indicating that it represents a relevant environmental indicator. In The Netherlands and in Flanders, this index has been incorporated into legislation, whereby a degree of P saturation that exceeds 25% is defined as unacceptable due to the risk of P transfer to the soil solution and water (Breeuwsma et al., 1995).
26Agronomic and environmental thresholds. To be relevant as an agronomic indicator, the amount of extractable P must be closely related to crop response, such as plant growth or uptake of P (Figure 2). The correlation between soil and plants can be conducted in greenhouse, a growth chamber, or on the field. Test calibrations must be conducted over a broad range of soils in order to define fertility classes according to soil properties, such as texture or pH values (Genot et al., 2011; Jordan-Meille et al., 2012).
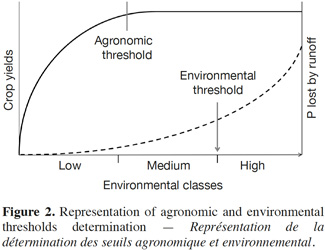
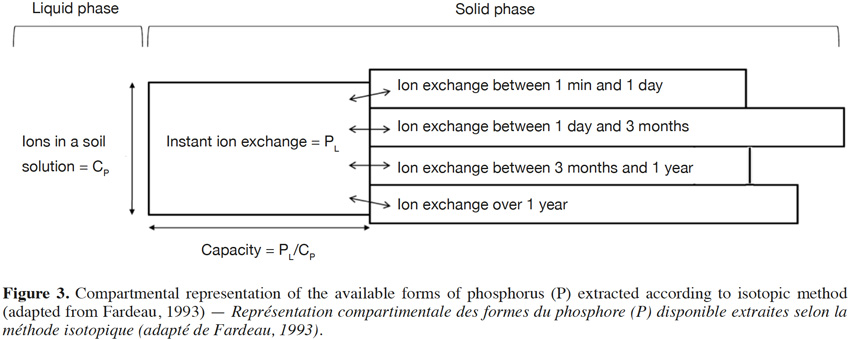
27Similarly, environmental threshold can be defined if extractable P is correlated with P lost by run-off and leaching. The threshold typically corresponds to:
28– the content of P which is tolerated in water upon legislation, or
29– the “change point” of the curve relating soil loss to soil P content, which is the point of the curve where the slope increases (Pote et al., 1999) (Figure 2).
30Generally, environmental threshold is higher than agronomic threshold, providing a control lever for the management of P.
2.2. Anion exchange resins and diffusive gradients in thin films (DGT)
31Anion exchange resins were developed for water and sediment samples in the 1930s to assess the presence of labile P in soil samples or the presence of P in soil solutions. Upon contact with water and soil, the anion exchange resins act as a sink for P. Since then, analytical protocols designed to mimic the effects of roots have evolved (Qian et al., 2002).
32In the 1990s, the use of DGT was preferred over anion exchange resins for estimates of P availability in soils to obviate the disadvantages of the latter (Chardon et al., 1996). These disadvantages included:
33– modification of the physicochemical balance of the soil examined;
34– the absence of an infinite binding capacity, thereby resulting in the potential for non-maximal desorption;
35– difficulty in separating the resin from the soil;
36– lack of specificity in the adsorption and desorption of certain anions;
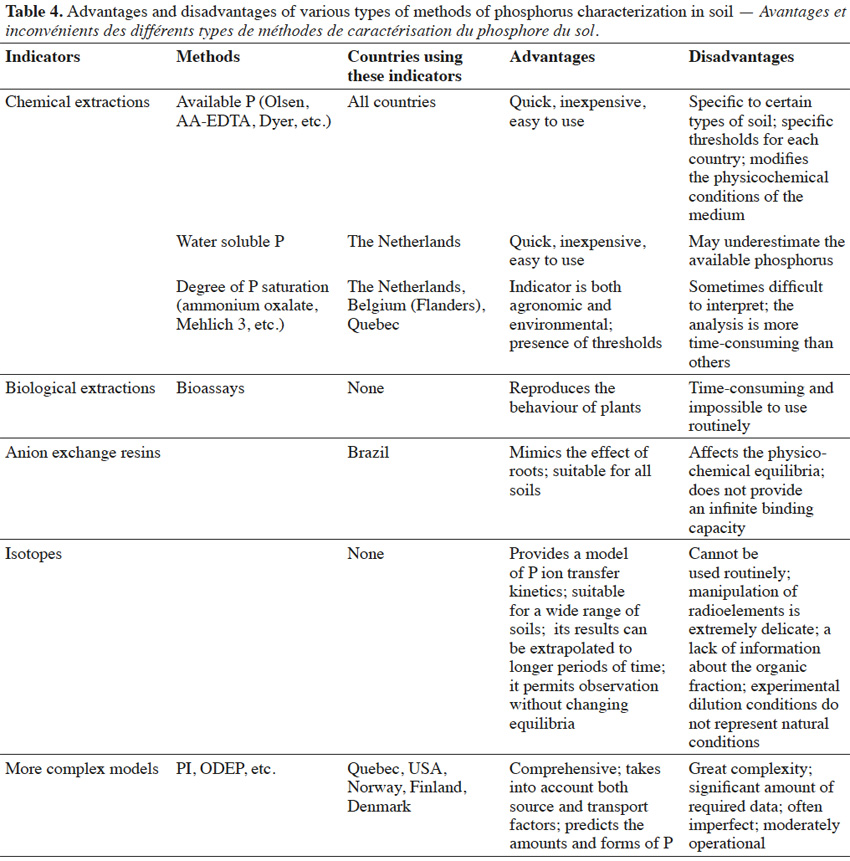
37– the influence of sulphate or nitrate concentrations on the quantities of P extracted.
38Diffusive gradients in thin films (DGT) are a passive sampling technique which has been successfully applied to aquatic systems for measuring P (Zhang et al., 1998), and more recently, for predicting crop response to applied P in soil (Mason et al., 2010). Based on the same principle as anion exchange resin, DGT is composed of a layer of ferrihydrite binding gel with a strong affinity for P behind a diffusive hydrogel layer and an overlying protective filter membrane (Six et al., 2012). Diffusive gradients in thin films can be placed directly onto a saturated soil paste, allowing for field measurements. Diffusive gradients in thin films provide a better estimate of P uptake by plants compared to certain chemical extraction methods (Zhang et al., 2014), and are less vulnerable to potential chemical constraints, such as anionic interferences or pH (Mason et al., 2008). Moreover, a low coefficient of determination for the regression fit between DGT and resin measurement was observed by Mason et al. (2008). Despite the results appearing hopeful for tropical soils, additional studies are necessary to expand the types of plants, soil, and climatic conditions that can be tested (especially in European soils), and to correctly interpret DGT-derived results (Zhang et al., 2014).
2.3. Biological extractions
39To overcome the disadvantages of chemical extractants, it has been proposed that plants could be used to evaluate the bioavailability of P.
40In bioassays, algae are grown in water in which P is a limiting factor, for which the only source is the soil sample. Unicellular algae are generally used in these tests, including Selesnatrum capricornutum or Scenedesmus quadricauda. The experiments are generally performed aerobically for 2 to 4 weeks, and the algae are renewed weekly (Ekholm et al., 2003). Phosphorus availability is calculated on the basis of the algae biomass present, and results can be extrapolated for longer periods of time to determine the long-term availability of P. Several studies, including that of Boström et al. (1988), have shown that the results obtained using such bioassays are consistent with results obtained using chemical extractions. However, bioassay results are only relevant for the experimental conditions tested, and cannot be extrapolated to the natural environment. Furthermore, numerous species of algae exist in natural environments, and they can adapt to various forms of P.
41Other biological methods have been used to estimate the capacity of a soil to supply P to a plant, including the use of micro-cultures (Stanford et al., 1957). In these cultures, plant growth is used to analyze the amount of absorbed P. Unlike chemical methods, this technique more accurately accounts for all of the factors affecting plant food.
42However, bioassays are difficult to establish, more time-consuming to perform, and the experiments must be repeated to achieve the repeatability and accuracy of results. Therefore, these bioassays do not represent a substitute for chemical extraction methods, but should rather be a method performed to complement chemical extraction methods.
2.4. Isotopic methods
43Time plays a significant role in determining P availability (Fardeau, 1993). Methods involving radioactive isotopes of P were developed in France by Fardeau (1993), and more recently by Morel et al. (2000) and Morel et al. (2014). Isotopes, unlike chemical reactions, enable the observation of soil behavior with regard to P without affecting the balance between the forms of P present in soil. The main isotopes used, 32P and 33P, have a half-life of 14.3 days and 23 days, respectively.
44In general, isotopic methods consist of an injection with a defined amount of radioactivity into a solution, followed by subsequent measurements of the radioactivity remaining in the solution after a defined period of time. The ability to detect P is based on three principles:
45– the concentration of phosphate ions in solution is constant over time;
46– the isotopic tracer is instantly and uniformly distributed in the soil solution;
47– the flow of labelled P ions is equal to the flow of unlabelled P ions (Némery, 2003).
48The kinetics of the isotopic exchange method also enables the development of a compartmental representation of soil P reserves, as shown in figure 3 (Fardeau, 1993). This diagram illustrates the heterogeneity of phosphate ions that have the potential to reach the soil solution over variable periods of time. Moreover, this representation can also be linked to chemical methods used to determine the available and total reserves of P (Figure 3). The shapes of the extracted P vary depending on the extractant used (Figure 3).
49Additional studies have demonstrated a range of potential applications for P isotopes. For example, in 2000, Morel used isotopic methods to model the dynamics of P ion transfer between soil and the soil solution as a function of the duration of P transfer and the concentration of P in solution. More recently, Morel et al. (2014) determined the relationship between the phosphate balance sheet and P exchanges using long-term test parcel data. Finally, P isotopes have been used in the study of plant growth and to measure the efficiency of plant growth following the addition of isotope-labelled fertilizers (Frossard et al., 1996).
50However, there are disadvantages associated with the use of isotopes. In addition to the lack of information regarding the organic fraction of P, this method cannot be routinely used, and the manipulation of radioelements is extremely delicate. Furthermore, it is difficult to generalize the results obtained under experimental conditions to events occurring naturally in soils. To address the latter point, scientists have attempted to relate the parameters of kinetic equations to the physicochemical characteristics of soil (Morel et al., 2014).
2.5. Complex models
51P indices for risk of P loss. Knowledge of a soil’s status is not sufficient for estimating the risk of P export to surface or subsurface water since the losses that occur are influenced by both source and transport factors. Indices for risk of P loss represent management tools at the scale of a parcel which are used to identify critical source areas of P loss and farming practices that increase the risk. Critical source areas of P loss can be defined by their coinciding source (soil, crop, and management inducing high P loss) and transport (runoff, erosion, and proximity to water course or body) factors (Sharpley et al., 2014). This indice was developed to solve problems of localized excess of P.
52Source factors represent the amount of P that can potentially be mobilized, as well as the conditions predisposing it to accumulation (e.g., soil test P, rate, method, timing of application of biological or mineral fertilizers, and leaching of P from plant residues), while transport factors are essentially hydrological in nature and affect the transport of P to rivers (e.g., erosion, surface run-off, subsurface drainage, connectivity). Phosphorus indices (PI) are simple models derived from the results of more complex experiments or models (Buczko et al., 2007).
53A number of P indices, all of which are based on the original PI of Lemunyon et al. (1993) (Equation 2), have been developed according to the regional characteristics of a given state and/or country. Several P indices use the Pennsylvania PI. Currently, the PI approach is routinely used in 47 U.S. states, some Canadian provinces, and was adopted by several European countries, including Finland (2001), Ireland (2003), Sweden (2005), Norway (2005), Denmark (2006), and Germany (currently in progress).
54Site vulnerability = 1.5*soil erosion + 1.5*irrigation erosion + 0.5*runoff class + 1*soil p test + 0.75*P fertilizer application rate + 0.5*P fertilizer application method + 1*organic P source application rate + 1*organic P source application method (Eq. 2)
55where the values for each characteristic are specified in Lemunyon et al. (1993), according to level.
56The primary advantage of using a PI is in its speed and ease of use. However, some parameters, such as mode of farm management, are difficult to map. In addition, a PI can accommodate corrective measures. Therefore, a PI is not only an indicator that can provide an integrative approach, but it can also be easily adapted to local conditions (Buczko et al., 2007). Correspondingly, P indices have become highly popular tools from both scientific and political standpoints. Phosphorus indices require readily available data, and they can be automated using computer software which links them to a database of interest.
57Modelling of P loss. Hydrological models of increasing complexity have been generated to quantify volumes of run-off water, as well as sediment loss and P loss, while also accounting for local specificities (e.g., connectivity of parcels with a river and topography, among others). With different models available, it may become difficult to select the most appropriate model. It is important to consider the scale of study for each of the models being considered, as well as their disadvantages. Hydrological models are very time-consuming and difficult to implement. In particular, they require extensive calibration, and are therefore not typically suitable for routine use. Moreover, these models can often prove to be inadequate due to ground conditions which are difficult to foresee and transfer processes which are not always complete. These models are based on the hypothesis that P transfer is a result of runoff and erosion. However, in practice, the situation is more complex.
58Nevertheless, some regions have developed these models and use them to evaluate the export of P from agricultural parcels. In particular, Quebec employs a Phosphorus Export Diagnostic Tool (ODEP) that is based on the SWAT model, and is able to integrate data regarding the topography, soil type, drainage, and agronomic management of a parcel. Consequently, this software tool can be used to quantify P losses, to identify the factors responsible for the losses, and to simulate different scenarios of P management. In Wallonia, Dautrebande et al. (2006) used the EPICgrid model to estimate P export from parcels.
3. Evaluation of different indicators
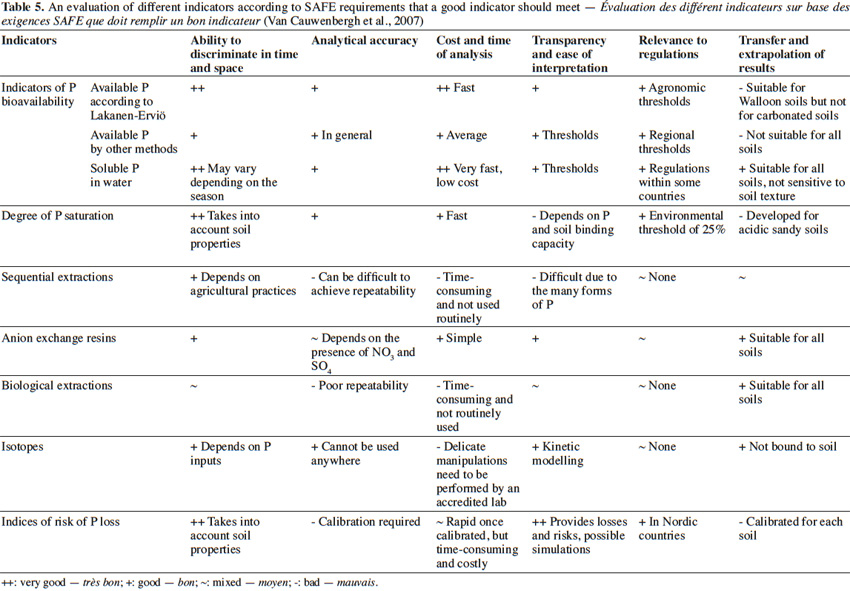
59Many indicators of P levels exist worldwide, and it is often difficult to select the most appropriate indicator. Moreover, many criteria exist to evaluate indicators, and each of the existing methods present advantages and disadvantages (Table 4). For this study, indicators were evaluated according to the framework of the “Sustainability Assessments of Farming and the Environment” (SAFE) hierarchical framework developed by Van Cauwenbergh et al. (2007). This framework has defined the following six criteria for environmental indicators:
60– ability to discriminate in time and space,
61– analytical accuracy,
62– cost and time of analysis,
63– ease of interpretation,
64– relevance to regulations,
65– the ability to extrapolate the results obtained using a given indicator.
66The main indicators were evaluated according to these criteria (Table 5).
67One of the most important considerations is the objective of the analysis to be performed, and therefore, the ability to discriminate in time and space. Three types of indicators exist: agronomic, environmental, and agro-environmental (Table 1). An indicator can be considered as having an agronomic interest if the relationship with plant uptake or yields has been proven. Similarly, a parameter can be considered as an environmental indicator when it presents a good relationship with P transferred to aquatic systems. Environmental indicators generally require mild extractants such as water or calcium chloride, which simulate desorption or solubilisation of P from soil to solution. Naturally, there is a link between these two objectives. When P in soil solution increases, P yield can increase, though P loss is also susceptible to increase. That is why some indicators as the degree of P saturation present both an agronomic and environmental interest.
68Secondly, according to SAFE criteria, indicators must be easy to analyze within a reasonable cost, and analysis should be accurate. Some analyses are time-consuming and expensive to implement, or require specific conditions (Table5). For example, isotopic methods, while being extremely accurate can only be performed by specialized laboratories. Moreover, although main extraction methods consist of a soil-extract suspension using a ratio which is seldom representative of soil conditions, ratios are often more representative of the aquatic environment. Each method extracts different forms of P and the chemical extractants often mobilize significant amounts of unavailable forms along with plant-available P (Frossard et al., 2004). Additionally, the determination of P can become unreliable in some soils if P concentrations in the extract are close to detection limits, as observed in water or CaCl2 extractions.
69Thirdly, Tiessen et al. (1993) stated that available P measures “a pool of soil P that is somehow related to that portion of soil P which is plant available”. Therefore, results should not be interpreted independently, but according to regional standards, which are defined according to experimentation with plants. To this end, Jordan-Meille et al. (2012) compared current methods used for recommending P fertilizers in Europe, despite the large number of analytical methods employed. Two different soils were tested, and the recommended P dosage varied between 0 and 89 kg P·ha-1 for both soils, depending on the country and method used.
70Lastly, extrapolating methods and results to other soils is not a simple task. Indeed, no one indicator is suitable for all soils. For example, levels of available P can be determined using the method of Joret et al. (1955). However, this method is more suitable for calcareous soils, whereas the Dyer method provides satisfactory results in soils ranging from acidic to neutral (Table 1).
71An ideal indicator should be scientifically validated, be relevant in relation to the stakeholders and objectives, discriminate against expected changes, have an interest/cost ratio greater than 1, be based on readily available data, and be consistent with existing regulations. However, in practice, indicators rarely fulfill all of these criteria. Therefore, the selection of an indicator is based on a compromise between fixed objectives and cost in order to characterize a complex and often problematic phenomenon. Based on the criteria established by Van Cauwenbergh et al. (2007), it is evident that water extraction of P was one of the most advantageous indicators available (Table 5). In contrast, other methods, such as sequential fractionation, are of little to no interest.
72In practice, indicators are often correlated to each other. Phosphorus availability is determined by total P content and buffering capacity. Currently, the selection of indicators for a given country or region is a result of historical origin. It is very difficult to introduce changes into these methodologies, primarily due to the necessity of ensuring the standardization and continuity of databases, and the use of specific thresholds.
4. Which indicators can be used in Wallonia?
73In Wallonia (Belgium), there are no measures currently scheduled to assess the management status of P. Incidentally, according to the Organisation for Economic Co-operation and Development (OECD), Belgium is considered as the first European country to possess a surplus of P delivered to agricultural parcels. This surplus, amounting to 21 kg P·ha-1·yr-1, is largely the result of pig farms being primarily located in Flanders. However, Wallonia contains lower surplus, despite significant regional disparities (Genot et al., 2009; Renneson et al., 2015).
74In Wallonia, the soils predominantly range from neutral to acidic, and P extraction has been routinely performed by soil analysis laboratories since 1990 using ammonium acetate and EDTA (pH 4.65) (Lakanen et al., 1971). Ammonium acetate is used to dissolve any aluminium phosphate present, while the acidity leads to a reversible release of P from iron, aluminium, and partly calcium (Hons et al., 1990; Woodard et al., 1994). The chelating agent, EDTA, aids in the prevention of newly released P from binding to iron (Dao, 2004). Thus, ammonium acetate facilitates the dissolution of a subset of P associated with iron oxide molecules that are either not crystallized or slightly crystallized, corresponding with the different forms of P that are available to plants. However, ammonium acetate is largely unable to dissolve calcium phosphates, thus rendering it unsuited to carbonated soils. In Wallonia, carbonated soils represent less than one per cent of the territory.
75According to table 5, available P from Lakanen-Erviö (PAA-EDTA) presents different advantages. However, to be an adequate agronomic indicator, it should be related to P uptake or yields. Hons et al. (1990), Homsy (1992) and Woodard et al. (1994) studied the relationship between P exported by plants and yields. PAA-EDTA was correlated with P fertilizer level P (R² = 0.89), primarily in slightly acidic soils (Hons et al., 1990). In a study by Woodard et al. (1994), PAA-EDTA predicted yields and P concentration responses in plants more accurately than Olsen P. Thresholds have been defined for Wallonia according to P plant levels and soil property results (Genot et al., 2011).
76Significant correlations between PAA-EDTA and other P extraction methods have been observed, most strongly with the methods of Bray, Olsen, and Sissingh (Ryser et al., 2001). Hons et al. (1990) and Homsy (1992) found R2 values (between ammonium acetate and EDTA extraction and others) varying between 0.66 and 0.91 and between 0.64 and 0.90, respectively, depending on the soil. Therefore, the Lakanen-Erviö method is well correlated with other predominant methods used worldwide. Neyroud et al. (2003) classified the amount of extractable P according to 16 methods. The Lakanen-Erviö method extracts less P than Mehlich 3 or Bray methods, but more than the Olsen method.
77The northern region of Belgium consists of soils (loamy and sandy texture) which exhibit a relatively limited P binding capacity and relatively high levels of available P. Extraction of P by the method of Lakanen et al. (1971) has been performed in Wallonia in an agricultural context without consideration for its impact on the environment. Celardin (2003) discovered a significant relationship between Lakanen-Erviö P content and water-extractable P, which is representative of P loss risk (R² of 0.625 and 0.47 for pH 4.6-6.5 and pH 6.6-8.6, respectively). Houben et al. (2011) and Renneson et al. (2015) have evaluated the potential for using the degree of P saturation as an environmental indicator in the Walloon region. The latter may represent a promising indicator of P status in Wallonia, provided that the existing equations are adapted to the soil characteristics beforehand (Renneson et al., 2015). Moreover, Renneson et al. (2015) showed that extraction of P using the method of Lakanen et al. (1971) correlated (R = 0.78) with the extraction of P performed with ammonium oxalate, which is used for calculating the degree of P saturation.
78Other indicators such as P index for risk of P loss could be developed. However, relatively few data are currently available regarding the amount of P loss occurring in the agricultural parcels of Wallonia.
5. Conclusions
79A profusion of P indicators types can be found in the literature. The majority of indicators currently used are designed to characterize the status of the soil based on their P content, whereas other, more complex indicators are designed to model P flow to the environment and estimate the risk of P loss. The latter assesses P loss while simulating contributions to, or management of, P content. This approach has a certain advantage, yet these methods can be time-consuming difficult to implement. Consequently, most countries use simpler measurement indicators of soil P, involving various types of analyses ranging from single extraction methods to the use of P isotopes. Several methods also use ion exchange resins or biological extractions. Moreover, some authors have combined single extractions to measure P forms into the soil (sequential extraction).
80Correlations can often be found between the different indicators reported in the literature. However, these results can rarely be applied generally and depend from one soil to another. Some authors have proposed a classification system based on the amount of P that is extracted. However, this is not universal for all types of soil.
81Each of the methods available has certain advantages and disadvantages, and no indicator is suitable for every soil. The appropriateness of all indicator types has been evaluated according to various criteria. The selection of an indicator is generally a compromise between fixed objective and other criteria, such as the cost and time of analysis. However, to make a choice in existing indicators, a global analysis must be made. Some indicators, such as isotopic methods have great potential as P indicators, though their routine use is difficult (necessity of specialized laboratories). Current indicators are generally explained by their historical use. Some authors suggest that extraction methods should be harmonized throughout Europe. However, it is difficult to change a method due to the inadequacy in some soils, lack of threshold in each country, and the necessity to maintain soil quality monitoring.
82At present, in Wallonia (southern Belgium), P extraction has been performed using ammonium acetate and EDTA (pH 4.65). This extraction method is well correlated with other extraction methods and crop yields. A reflection is made to study the interest of other indicators as the degree of P saturation which is an environmental indicator.
83This review highlights the importance of careful consideration of indicator choice, and the establishment of interpretation thresholds. This review creates a comparison of appropriate and regionalized reference values.
Bibliographie
Beauchemin S. & Simard R.R., 1999. Soil phosphorus saturation degree: review of some indices and their suitability for P management in Quebec, Canada. Can. J. Soil Sci., 79, 615-625.
Beaudin I., 2006. Revue de littérature. La mobilité du phosphore. Québec, Canada : Centre de référence en agriculture et agroalimentaire du Québec.
Beck M.A. & Sanchez P.A., 1994. Soil phosphorus fraction dynamics during 18 years of cultivation on a typic paleudult. Soil Sci. Soc. Am. J., 58, 1424-1431.
Boström B., Persson G. & Broberg B., 1988. Bioavailability of different phosphorus forms in freshwater systems. Hydrobiologia, 170, 133-155.
Bozongo J.C., Bertru G. & Martin G., 1989. Les méthodes de spéciation du phosphore dans les sédiments : critiques et propositions pour l'évaluation des fractions minérales et organiques. Arch. Hydrobiol., 116, 61-69.
Bray R.H.K. & Kurtz L.T., 1945. Determination of total, organic and available forms of phosphorus in soils. Soil Sci., 59, 39-45.
Breeuwsma A., Reijerink J.G.A. & Schoumans O.F., 1995. Impact of manure on accumulation and leaching of phosphate in areas of intensive livestock farming. In: Steele K., ed. Animal waste and the land water interface. New York, USA: Lewis-CRC, 239-251.
Buczko U. & Kuchenbuch R.O., 2007. Phosphorus indices as risk-assessment tools in the U.S.A. and Europe - a review. J. Plant Nutr. Soil Sci., 170, 445-460.
Celardin F., 2003. Evaluation of soil P-test values of canton Geneva/Switzerland in relation to P loss risks. J. Plant Nutr. Soil Sci., 166, 416-421.
Chang S.C. & Jackson M.L., 1957. Fractionation of soil phosphorus. Soil Sci., 84, 133-144.
Chardon W.J., Menon R.G. & Chien S.H., 1996. Iron oxide impregnated filter paper (Pi test): a review of its development and methodological research. Nutr. Cycling Agroecosyst., 46, 41-51.
Condron L.M., Turner B.L. & Cade-Menun B.J., 2005. Chemistry and dynamics of soil organic phosphorus. In: Sims J.T. & Sharpley A.N., eds. Phosphorus: agriculture and the environment. Madison, WI, USA: American Society of Agronomy, 87-121.
Dao T.H., 2004. Ligands and phytase hydrolysis of organic phosphorus in soils amended with dairy manure. Agron. J., 96, 1188-1195.
Dautrebande S. & Sohier C., 2006. L'érosion hydrique et les pertes en sols agricoles en Région wallonne. Rapport analytique 2006 sur l'état de l'environnement wallon. Gembloux, Belgique : Faculté universitaire des Sciences agronomiques de Gembloux.
Dyer B., 1894. On the analytical determination of probably available mineral plant food in soils. J. Chem. Soc., 65, 115-167.
Egner H., Riehm H. & Domingo W.R., 1960. Untersuchungen über die chemische Bodenanalyse als Grundlage für die Beurteilung des Nährstoffzustandes der Böden. II. Chemische Extraktionsmethoden zur Phosphor und Kalium-bestimmung. Kungliga Lantbrukshögskolans Annaler, 26, 45-61.
Ekholm P. & Krogerus K., 2003. Determining algal-available phosphorus of differing origin: routine phosphorus analyses versus algal assays. Hydrobiologia, 492, 29-42.
Fardeau J.-C., 1993. Le phosphore assimilable des sols : sa représentation par un modèle fonctionnel à plusieurs compartiments. Agronomie, 13, 317-333.
Fardeau J.C. & Conesa A.P., 1994. Le phosphore. In : Bonneau B. & Souchier M., éds. Pédologie. 2. Constituants et propriétés du sol. Paris : Masson Publishing, 649-658.
Frossard E., Sinaj S., Zhang L.-M. & Morel J.-L., 1996. The fate of sludge phosphorus in soil-plant systems. Soil Sci. Soc. Am. J., 60, 1248-1253.
Frossard E., Julien P., Neyroud J.-A. & Sinaj S., 2004. Le phosphore dans les sols. État de la situation en Suisse. Cahier de l'environnement n°368. Berne : Office fédéral de l'environnement, des forêts et du paysage.
Genot V., Colinet G., Brahy V. & Bock L., 2009. L’état de fertilité des terres agricoles et forestières en région wallonne (adapté du chapitre 4 - sol 1 de « L’État de l’Environnement wallon 2006-2007 »). Biotechnol. Agron. Soc. Environ., 13, 121-138.
Genot et al., 2011. Un conseil de fumure raisonné. Le cas du phosphore. Gembloux, Belgique : REQUASUD.
Golterman H.L., 1995. The role of ironhydroxyde-phosphate-sulphide system in the phosphate exchange between sediments and overlying water. Hydrobiologia, 297, 43-54.
Hedley M.J., Stewart J.W.B. & Chauhan B.S., 1982. Changes in inorganic and organic soil phosphorus fractions induced by cultivation practices and by laboratory incubations. Soil Sci. Soc. Am. J., 46, 970-976.
Hieltjes A.H.M. & Lijklema L., 1980. Fractionation of inorganic phosphates in calcareous sediments. J. Environ. Qual., 9, 405-407.
Hinsinger P., 2001. Bioavailability of soil inorganic P in the rhizosphere as affected by root-induced chemical changes: a review. Plant Soil, 237, 173-195.
Homsy S., 1992. Comparaison de quatre méthodes utilisées en routine dans les laboratoires européens pour l’appréciation de l’offre en phosphore disponible du sol. Mémoire : Faculté universitaire des Sciences agronomiques de Gembloux (Belgique).
Hons F.M., Larsonvollmer L.A. & Locke M.A., 1990. NH4OAC-EDTA-Extractable phosphorus as a soil test procedure. Soil Sci., 149, 249-256.
Hooda P.S. et al., 2000. Relating soil phosphorus indices to potential phosphorus release to water. J. Environ. Qual., 29, 1166-1171.
Houba V.J.G., Temminghoff E.J.M., Gaikhorst G.A. & van Vark W., 2000. Soil analysis procedures using 0.01 M calcium chloride as extraction reagent. Commun. Soil Sci. Plant Anal., 31, 1299-1396.
Houben D., Meunier C., Pereira B. & Sonnet P., 2011. Predicting the degree of phosphorus saturation using the ammonium acetate-EDTA soil test. Soil Use Manage., 27, 283-293.
ISO 11263:1994, 1994. Soil quality - Determination of phosphorus - Spectrometric determination of phosphorus soluble in sodium hydrogen carbonate solution. Vernier, Switzerland: ISO.
Jordan-Meille L. et al., 2012. An overview of fertilizer-P recommendations in Europe: soil testing, interpretation, and fertilizer recommendations. Eur. J. Soil Sci., 28, 419-435.
Joret G. & Hébert J., 1955. Contribution à la détermination du besoin des sols en acide phosphorique. Ann. Agron., 2, 233-299.
Khiari L. et al., 2000. An agri-environmental phosphorus saturation index for acid coarse-textured soils. J. Environ. Qual., 29, 1561-1567.
Lakanen E. & Erviö R., 1971. A comparison of eight extractants for the determination of plant available micronutrients in soils. Acta Agralia Fennica, 123, 223-232.
Leinweber P., Meissner R., Eckhardt K.U. & Seeger J., 1999. Management effects on forms of phosphorus in soil and leaching losses. Eur. J. Soil Sci., 50, 413-424.
Lemunyon J.L. & Gilbert R.G., 1993. The concept and need for a phosphorus assessment tool. J. Prod. Agric., 6, 449-450.
Levy E.T. & Schlesinger W.H., 1999. A comparison of fractionation methods for forms of phosphorus in soils. Biogeochemistry, 47, 25-38.
Maguire R.O. & Sims J.T., 2002. Soil testing to predict phosphorus leaching. J. Environ. Qual., 31, 1601-1609.
Mason S., Harnon R., Zhang H. & Anderson J., 2008. Investigating chemical constraints to the measurement of phosphorus in soils using diffusive gradients in thin films (DGT) and resin methods. Talanta, 74, 779-787.
Mason S., McNeillA., McLaughlin M.J. & Zhang H., 2010. Prediction of wheat response to an application of phosphorus under field conditions using diffusive gradients in thin films (DGT) and extraction methods. Plant Soil, 337, 243-258.
McIntosh J.L., 1969. Bray and Morgan soil test extractants modified for testing acid soils from different parent materials. Agron. J., 61, 259-265.
Mehlich A., 1953. Determination of P, Ca, Mg, K, Na, NH4. Raleigh, NC, USA: Department of Agriculture.
Mehlich A., 1984. Mehlich 3 soil test extractant: a modification of Mehlich 2 extractant. Commun. Soil Sci. Plant Anal., 15, 1409-1416.
Morel C., Tunney H., Plenet D. & Pellerin S., 2000. Transfer of phosphate ions between soil and solution: perspectives in soil testing. J. Environ. Qual., 29, 50-59.
Morel C. et al., 2014. Modeling of phosphorus dynamics in contrasting agroecosystems using long-term field experiments. Can. J. Soil Sci., 94, 377-387.
Morgan M.F., 1941. Chemical soil diagnosis by the universal test system. New Haven, CT, USA: Connecticut Agricultural Experiment Station.
Negassa W. & Leinweber P., 2009. How does the Hedley sequential phosphorus fractionation reflect impacts of land use and management on soil phosphorus: a review. J. Plant Nutr. Soil Sci., 172, 305-325.
Némery J., 2003. Origine et devenir du phosphore dans le continuum aquatique de la Seine des petits bassins amont à l'estuaire : rôle du phosphore échangeable sur l'eutrophisation. Thèse de doctorat : Université Paris VI - Pierre et Marie Curie (France).
Neyroud J.A. & Lischer P., 2003. Do different methods used to estimate soil phosphorus availability across Europe give comparable results? J. Plant Nutr. Soil Sci., 166, 422-431.
NF X 31-147, 1996. Qualité des sols – Sols, sédiments - Mise en solution totale par attaque acide. La Plaine Saint-Denis, France : AFNOR.
NF X 31-160, 1999. Qualité des sols – Détermination du phosphore soluble dans une solution à 20 g·l-1 d'acide citrique monohydraté – Méthode Dyer. La Plaine Saint-Denis, France : AFNOR.
NF X 31-161, 1999. Qualité des sols – Détermination du phosphore soluble dans une solution d'oxalate d'ammonium à 0,1 mol·l-1 – Méthode Joret-Hébert. La Plaine Saint-Denis, France : AFNOR.
Oberson A., Besson J.M., Maire N. & Sticher H., 1996. Microbiological processes in soil organic phosphorus transformations in conventional and biological cropping systems. Biol. Fertil. Soils, 21, 138-148.
Olsen S.R., Cole C.V., Watanabe F.S. & Dean L.A., 1954. Estimation of available phosphorus in soils by extraction with sodium bicarbonate. USDA Circular No 939. Washington: US Government Printing Office.
Paludan C. & Jensen H.S., 1995. Sequential extraction of phosphorus in freshwater wetland and lake sediment: significance of humic acids. Wetlands, 15, 365-373.
Pansu M. & Gautheyrou J., 2003. L'analyse du sol minéralogique, organique et minérale. Paris : Springer.
Pierzynski G.M., McDowell R.W. & Sims J.T., 2005. Chemistry, cycling, and potential movement of inorganic phosphorus in soils. In: Sims J.T. & Sharpley A.N. Phosphorus: agriculture and the environment. Madison, WI, USA: American Society of Agronomy, 53-86.
Pote D.H. et al., 1999. Relationship between phosphorus levels in three Ultisols and phosphorus concentrations in runoff. J. Environ. Qual., 28, 170-175.
Proix N., 2013. Revue des méthodes d’analyses agronomiques utilisées en Europe. In : Actes des 11e Rencontres de la fertilisation raisonnée et de l’analyse de terre, 20-21 novembre 2013, COMIFER-GEMAS, Poitiers, France.
Qian P. & Schoenau J.J., 2002. Practical applications of ion exchange resins in agricultural and environmental soil research. Can. J. Soil Sci., 82, 9-21.
Renneson M. et al., 2013. Relationships between the P status of surface and deep horizons of agricultural soils under various cropping systems and for different soil types: a case study in Belgium. Soil Use Manage., 29, 94-102.
Renneson M. et al., 2015. Degree of phosphorus saturation in agricultural loamy soils with a near-neutral pH. Eur. J. Soil Sci., 66, 33-41.
Ruttenberg K.C., 1992. Development of a sequential extraction method for different forms of phosphorus in marine sediments. Limnol. Oceanogr., 37, 1460-1482.
Rydin E. & Welch E.B., 1998. Aluminium dose required to inactivate phosphate in lake sediments. Water Res., 32, 2969-2976.
Ryser J.-P., Walther U. & Flisch R., 2001. Données de base pour la fumure des grandes cultures et des herbages. Rev. Suisse Agric., 33, 80.
Schüller H., 1969. Die CAL- Methode, eine neue Methode zur Bestimmung des pflanzenverfugbaren Phosphates in Boden. Z. Pflanzenernahr. Bodenkd., 123, 48-63.
Sharpley A. & Wang X., 2014. Managing agricultural phosphorus for water quality: lessons from the USA and China. J. Environ. Sci., 26, 1770-1782.
Sissingh H.A., 1971. Analytical technique of the Pw method, used for the assessment of the phosphate status of arable soils in The Netherlands. Plant Soil, 34, 483-486.
Six L. et al., 2012. The performance of DGT versus conventional soil phosphorus tests in tropical soils - an isotope dilution study. Plant Soil, 359, 267-279.
Stanford G. & DeMent J.D., 1957. A method for measuring short-term nutrient absorption by plants: I. phosphorus. Soil Sci. Soc. Am. J., 21, 612-617.
Taoufik M., Kemmou S., Idrissi L.L. & Dafir J.E., 2004. Comparaison de deux méthodes de spéciation du phosphore dans des sédiments de la partie aval du bassin Oum Rabiaa (Maroc). Water Qual. Res. J. Can., 39, 50-56.
Tiessen H. & Moir J.O., 1993. Characterization of available P by sequential extraction. In: Carter M.R., ed. Soil sampling and methods of analysis. Boca Raton, FL,USA: Canadian Society of Soil Science, Lewis Publishers, 75-86.
Tran T.S. & Giroux M., 1985. Comparison of several methods of extracting available P in relation with the chemical and physical properties. Can. J. Soil Sci., 65, 35-46.
Truog E., 1930. Determination of readily available phosphorus of soils. J. Am. Soc. Agron. J., 22, 874-882.
Van Cauwenbergh N. et al., 2007. SAFE - A hierarchical framework for assessing the sustainability of agricultural systems. Agric. Ecosyst. Environ., 120, 229-242.
van der Zee S.E.A.T.M. & van Riemsdijk W.H., 1988. Model for long-term phosphate reaction kinetics in soil. J. Environ. Qual., 17, 35-41.
Williams J.D.H., Syers J.K. & Walter T.W., 1967. Fractionation of soil inorganic phosphate by a modification of Chang and Jackson procedure. Soil Sci. Soc. Am. J., 31, 736-739.
Woodard H.J. et al., 1994. A preliminary comparison of the ammonium acetate-EDTA soil phosphorus extraction method to the Bray-1 and Olsen soil phosphorus extraction methods. Commun. Soil Sci. Plant Anal., 25, 2909-2923.
Zhang C., Davison W., Gadi R. & Kobayashi T., 1998. In situ measurement of dissolved phosphorus in natural waters using DGT. Anal. Chim. Acta, 370, 29-38.
Zhang C. et al., 2014. Bioavailability assessment of phosphorus and metals in soils and sediments: a review of diffusive gradients in thin films (DGT). Environ. Monit. Assess., 186, 7367-7378.